Closing Stock Statement
On this page
The Closing Stock Statement lists every item you have in stock on a date, with the quantity and what that quantity is worth. The value is worked out from your purchase bills: the stock you hold is taken to be the stock you bought last. Its total is the closing stock figure the Trading Account carries for the same date, so use it to check that figure.
Open the report
Press Alt+5 for Stock Reports, then Q. The statement opens as on today, for all categories and manufacturers, with the Normal report and GST included in the rates.
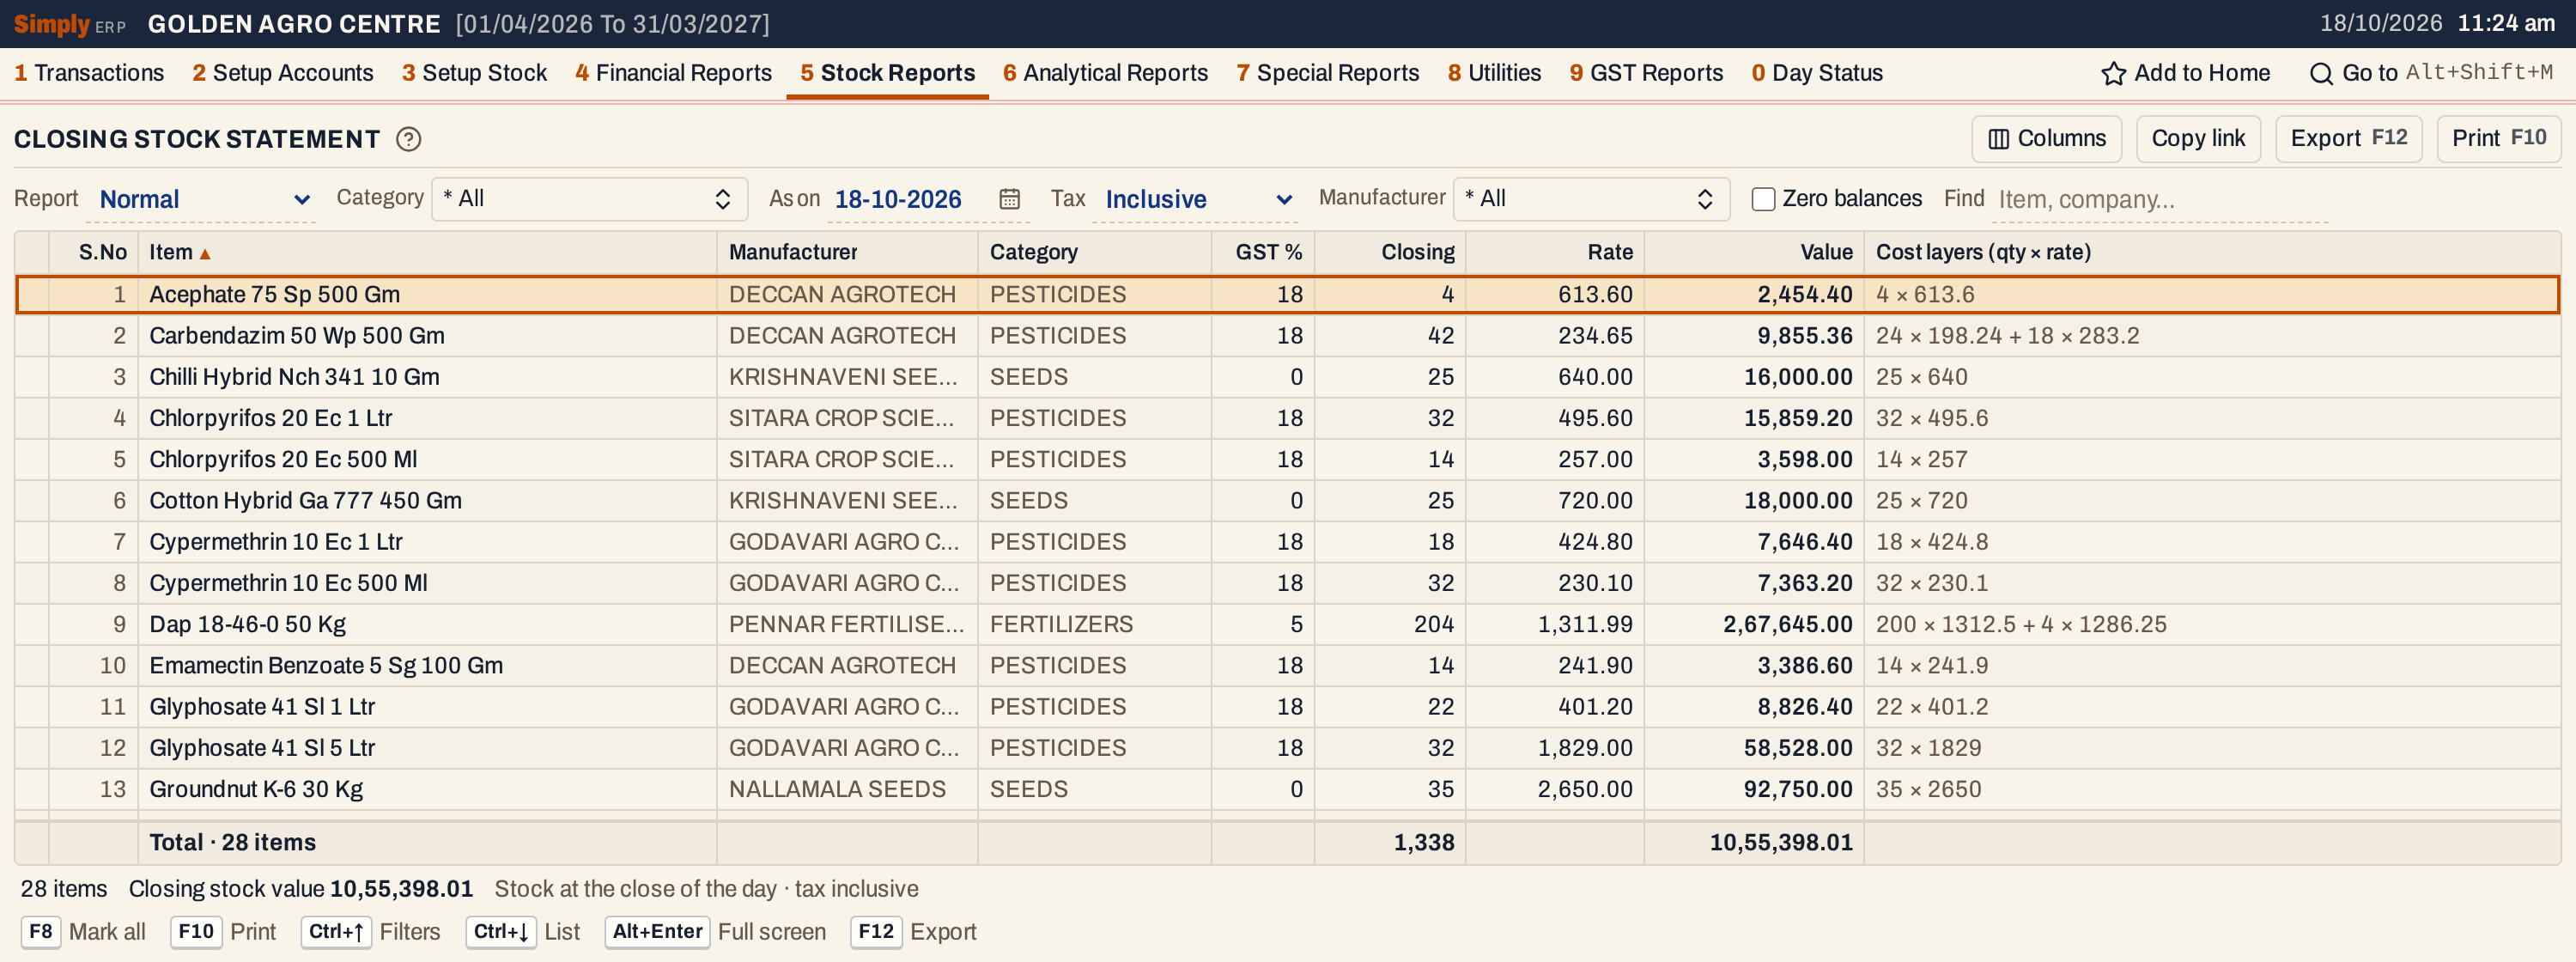 Each line is one item. Acephate 75 Sp 500 Gm has 4 units, valued at the purchase rate of 613.60, which is 2,454.40.
What it lists
One line for each item that has stock at the close of the As on date, including that day’s bills. An item with no stock, or with a negative stock, is not listed and has no value. The quantity is
the item’s opening stock + purchases + sales returns − sales − purchase returns − damage and breakage,
counting everything posted up to and including the As on date, with goods received and delivered (1 P) counted as purchases and sales. The Cost report is the exception: it does not take damage off.
Columns
| Column | What it shows |
|---|---|
| S.No | The line’s number. |
| Item | The item’s name. |
| Manufacturer | The item’s company. Shown when any item listed has one. |
| Category | The item’s category. Not shown when you choose exactly one category. |
| GST % | The item’s GST rate. |
| Closing | The units in stock as on the date. |
| Rate | The value divided by the closing stock: the average cost of a unit. In the Cost report, divided by the units that have a cost. |
| Value | The value of the stock of the item, to the paisa. |
| No cost | Units that have no recorded cost and so add nothing to the value. Shown only in the Cost report, when there are any. |
| Cost layers (qty × rate) | The purchases the value was built from, such as 200 × 1312.5 + 4 × 1286.25: the units taken at each rate. |
The line under the grid adds up the closing stock and the value. The status line gives the number of items and the Closing stock value, which is the total.
Choices
| Choice | What it does |
|---|---|
| Report | Normal (the usual), GST rate wise or Cost (all items). See below. |
| Category | One or more categories, or * All. |
| As on | The date. It must fall in the financial year. |
| Tax | Inclusive (the usual): purchase rates include the GST charged on the bill. Exclusive: the rates are the prices before GST. |
| GST % | GST rate wise only: the rate to list. Blank lists every rate. |
| Manufacturer | One or more manufacturers, or * All. Shown when the items have manufacturers. |
| Zero balances | Items with no stock are never listed, so this box makes no difference. |
| Find | Shows only the items whose name, manufacturer or category matches what you type. |
| Columns | Hides S.No, Manufacturer, Category, GST %, Rate or Cost layers. The print leaves them out too. |
Click a column title to sort by it (Item, Manufacturer, GST %, Closing, Rate or Value), and click again to reverse. The items come in name order. Every choice is kept in the page address, so Copy link gives a link that opens the same statement.
 The choices above the grid.
How the figures are worked out
For each item with stock, the closing quantity is valued by taking its purchases from the newest backwards:
- Purchase layers. Every purchase bill line posted on or before the As on date is a layer: its units at its rate. A purchase is posted on its Recd. date. Lines are taken newest posting date first (lines of one day in the order they were entered) until the closing quantity is covered. A line with no rate is skipped.
- Anything left. If purchases do not cover the quantity, the rest, opening stock included, is valued at the item’s Op. price, which you set on the item’s packing line in its stock group (3 C).
The rate of a purchase layer is the line’s net amount including GST, after its discounts, divided by its units with Tax Inclusive, or the line’s price before GST with Exclusive. Sales returns and goods received are not layers: a returned unit is valued like any other unit.
Rate is Value ÷ Closing, and Value is the sum of quantity × rate over the layers, to the paisa. The totals are the sums of the lines.
For Dap 18-46-0 50 Kg, 204 bags are in stock: the 200 bags of the newest purchase at 1,312.50 and 4 bags of the one before at 1,286.25 give 2,62,500.00 + 5,145.00 = 2,67,645.00, a rate of 1,311.99.
With Tax Exclusive the same stock is valued on the prices before GST:
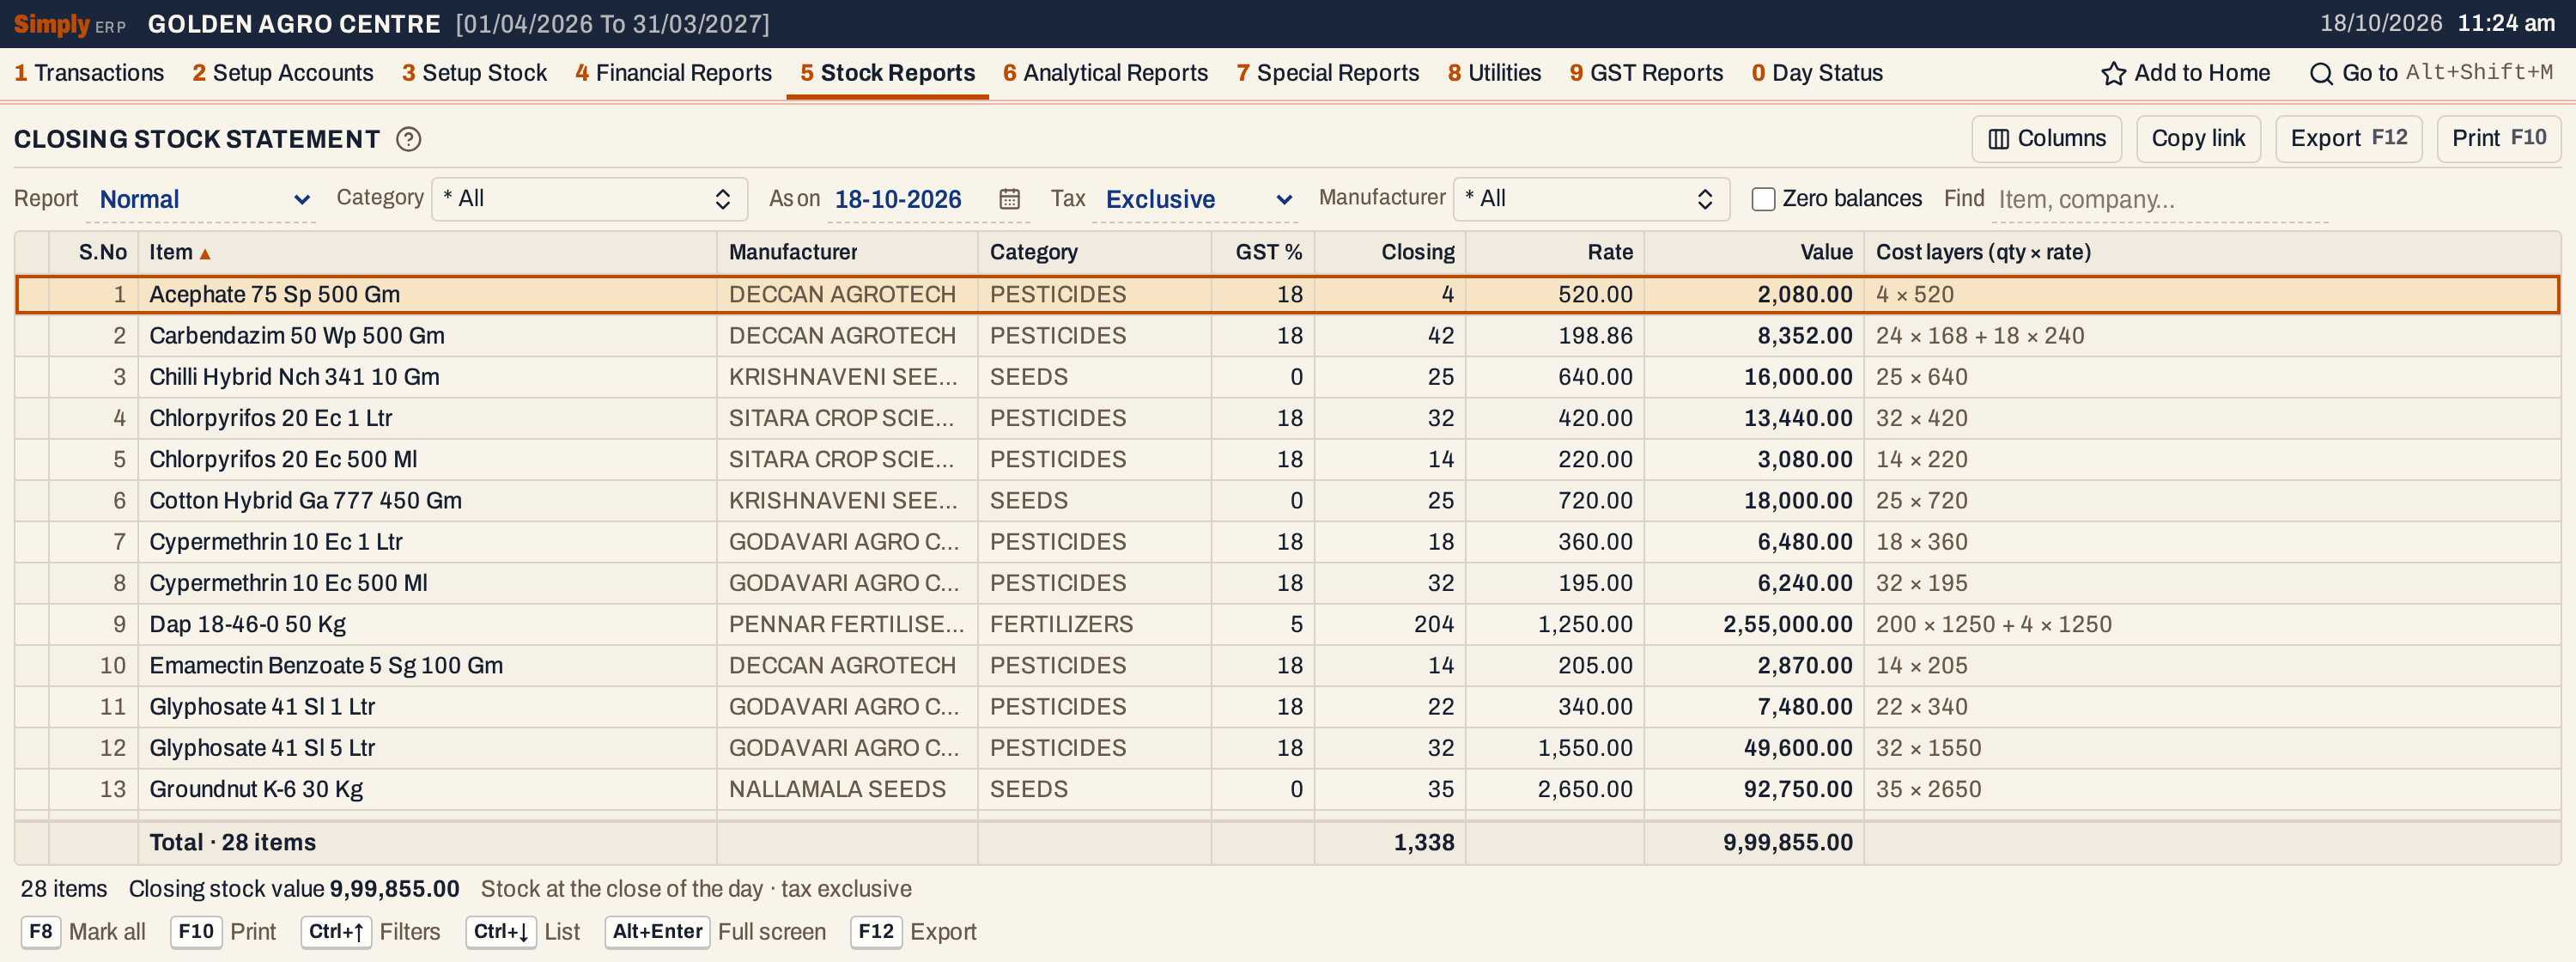 The rates are the before-GST prices: Acephate’s 613.60 becomes 520.00. The total becomes 9,99,855.00.
 The total of the Value column is the Closing stock value.
The Trading Account
The Normal report, and GST rate wise with GST % blank, value stock the same way as the Trading Account and the Balance Sheet, so the total here is the closing stock they carry for the same date and Tax choice, unless you typed a closing stock figure there. The Trading Account’s Closing Stock line opens the Closing Stock Valuation, a plainer list of the same values.
GST rate wise
GST rate wise lists only the items whose GST rate is the one you type in GST %, and values them only from the purchase lines charged at that rate. With GST % blank it lists every item.
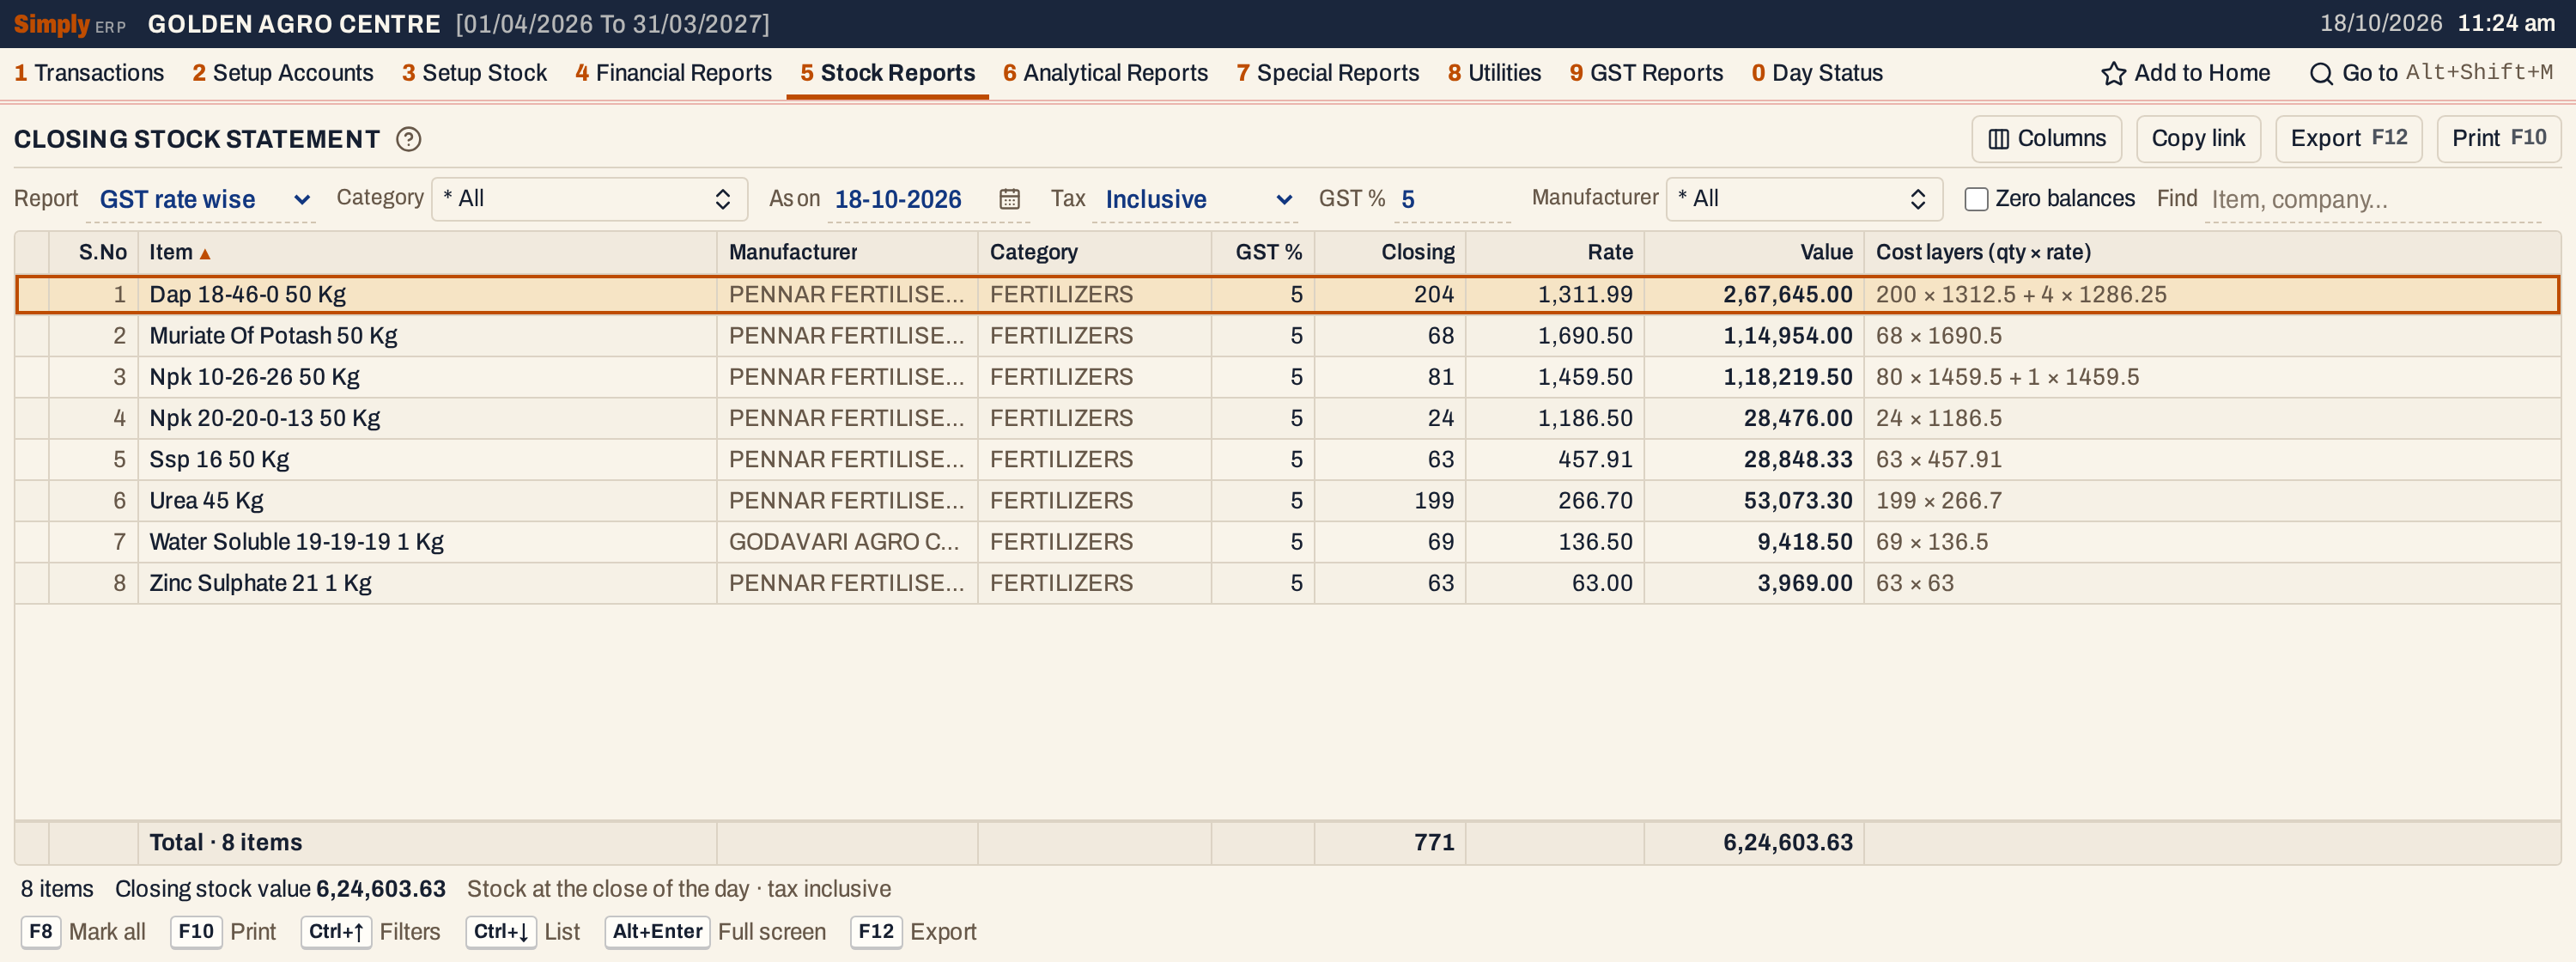 The 5% items are the eight fertilizers.
Cost (all items)
Cost (all items) values every item. It differs from the Normal report in three ways:
- the closing quantity does not take damage and breakage off;
- goods received (1 P) are cost layers too. Their cost is known once a bill is made from them; until then their units show in No cost;
- units that no layer covers, and units from an opening with no Op. price, are not valued: they add nothing and show in No cost, and the status line says how many. The Normal report values them at the Op. price.
Here three Acephate packs were written off as damaged. The Normal report has 4 left, and the Cost report still has 7:
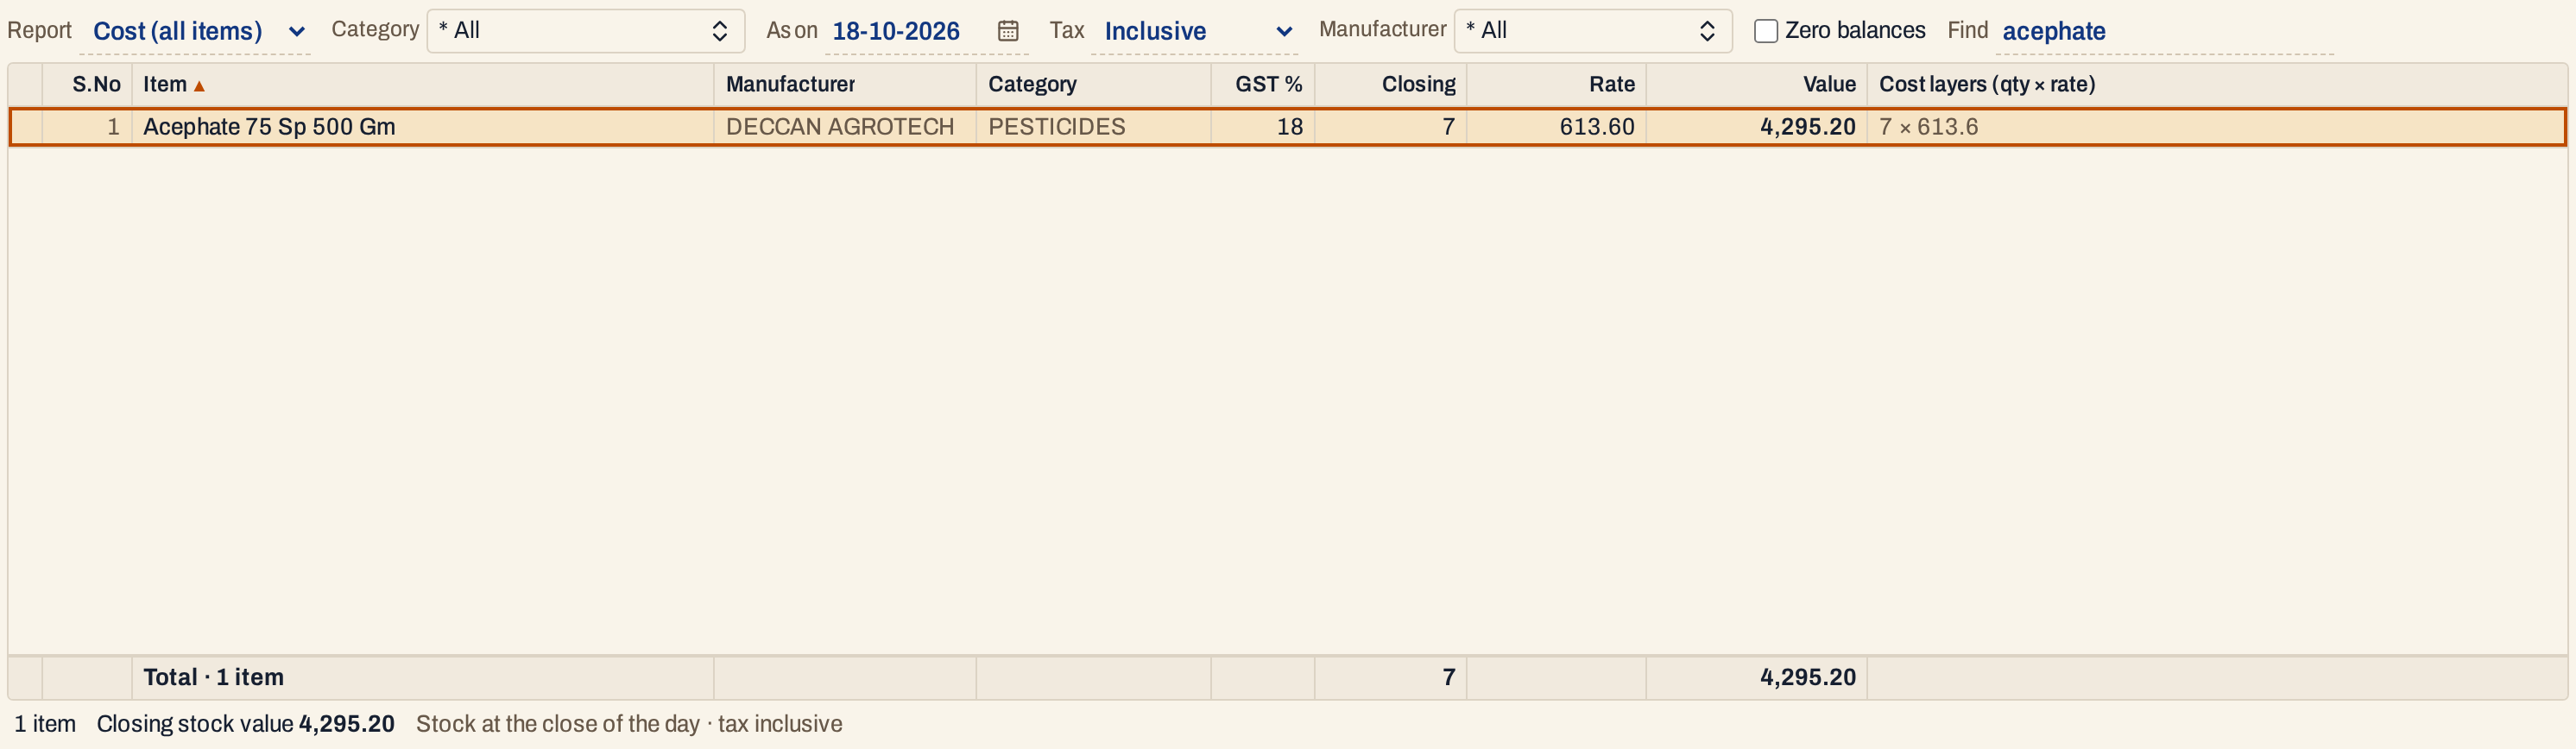 Cost does not take the 3 damaged units off: 7 × 613.60 is 4,295.20. Find is set to acephate.
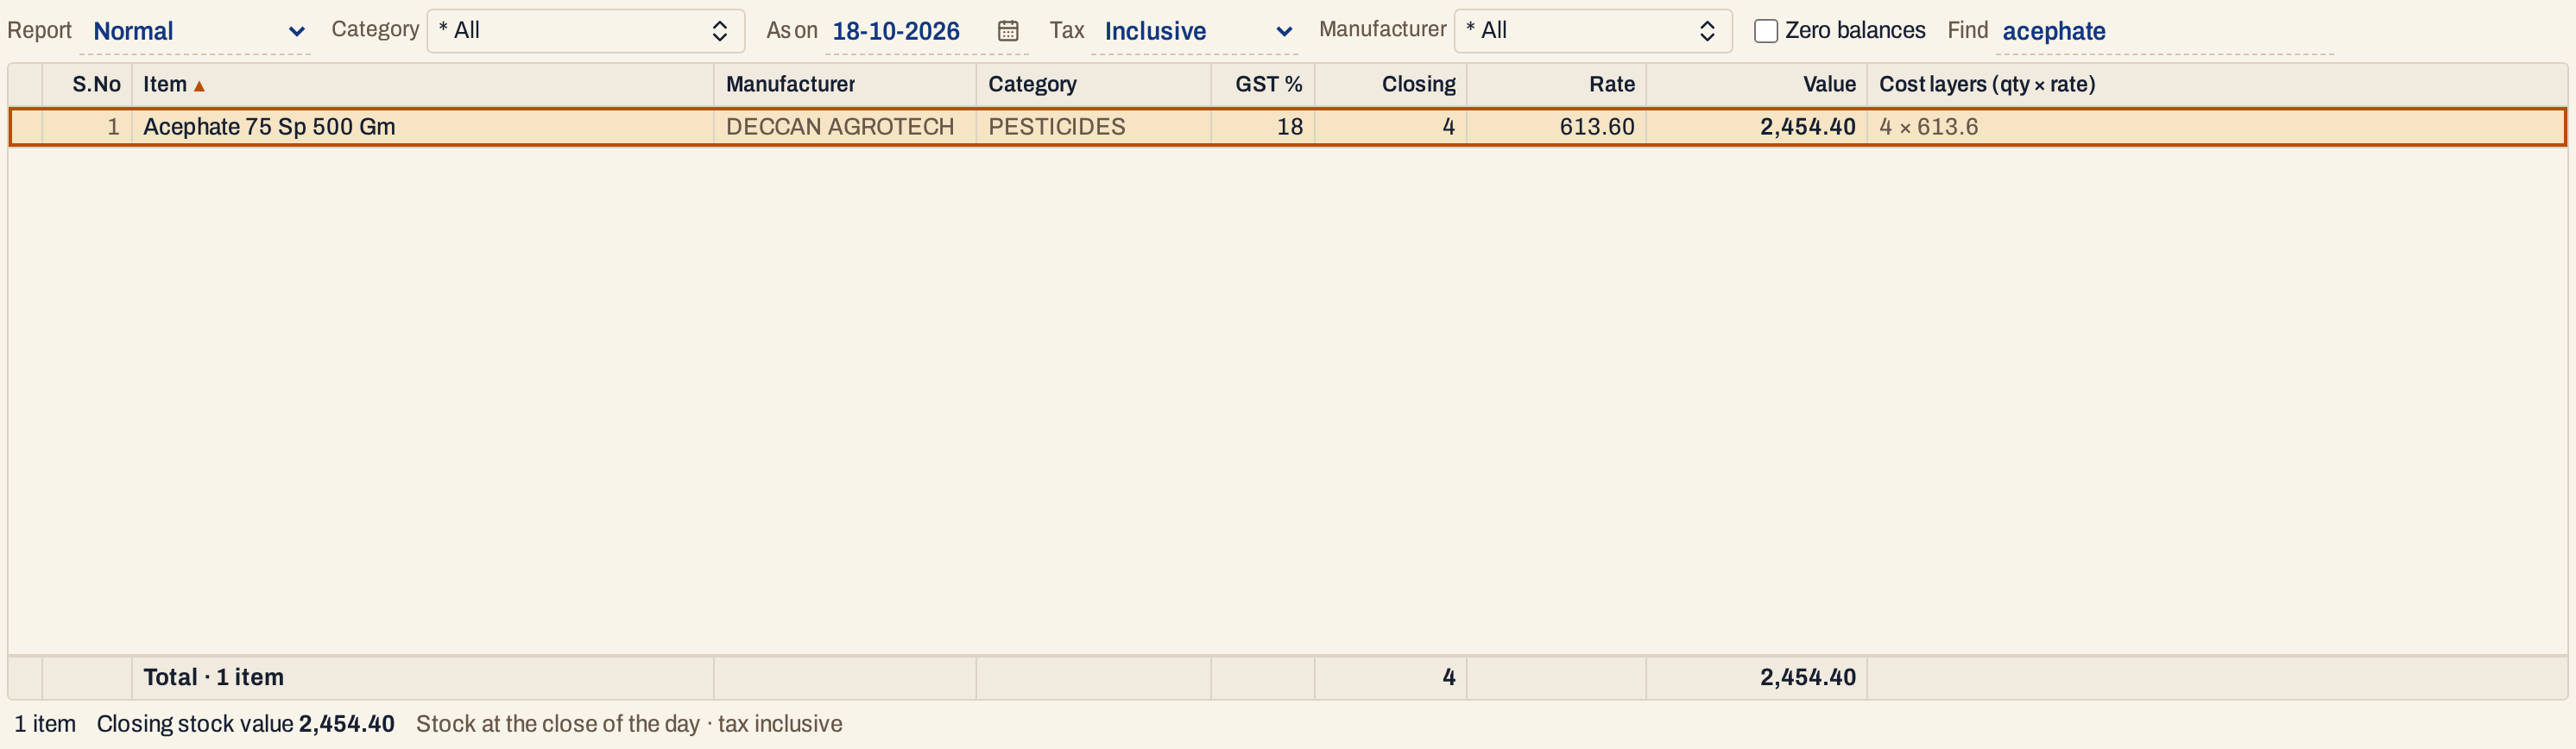 Normal does: 4 × 613.60 is 2,454.40.
Open, mark, print and export
- Enter on an item opens its Stock Ledger from the start of the financial year to the As on date.
- F2 marks an item and F8 marks them all. F10 then prints only the marked items, and the totals count only those.
- F10 prints the statement as it is on the screen, headed CLOSING STOCK STATEMENT (with the category’s name in front when you choose one category). Under it come the category with your licence numbers from Company Details, the As On date, and the Report and Tax Calculation choices, then any Manufacturer or Find choice. The Category column is left out of the print, and the last line is the Closing Stock Value.
- F12 saves it as an Excel workbook.
- Alt+Enter gives the whole window to the list.
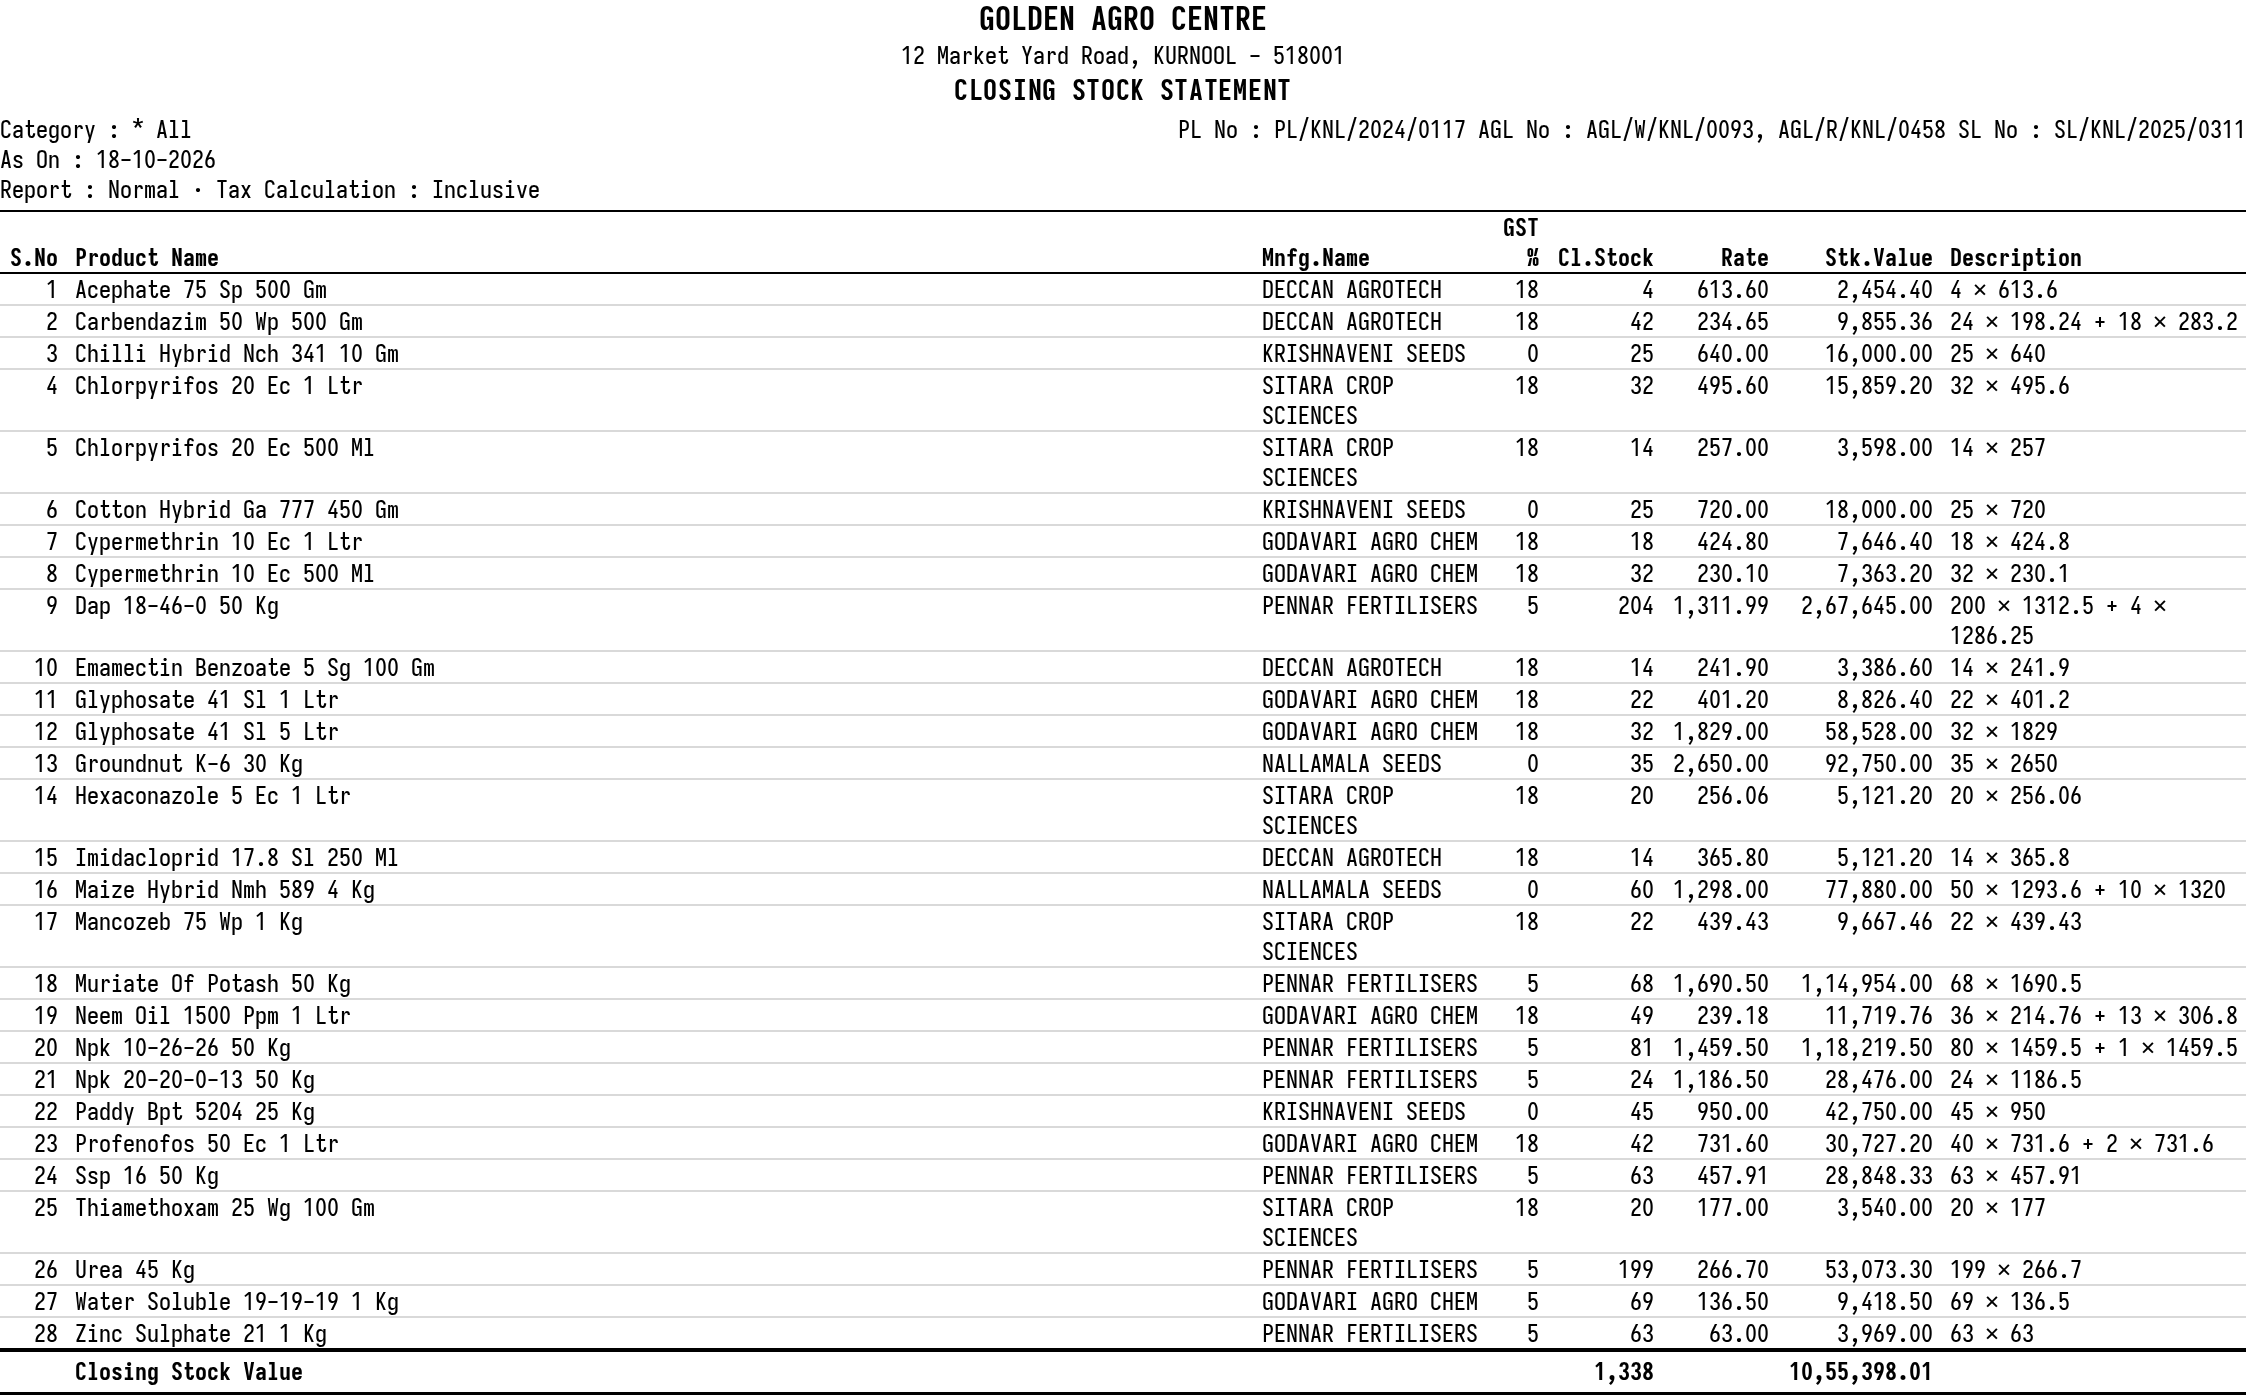 The print, with the value of each layer in the Description column.
Updated 4 November 2026.