Company Wise Analysis
On this page
The Company Wise Analysis report is a small trading account for one company whose goods you stock, such as one pesticide or seed maker. It sets what you bought from the company’s suppliers, and what you sold of its products, against the stock you started and ended the year with, and gives a net value. Use it to see what one company’s products have earned you over the year.
Open the report
Press Alt+7 for Special Reports, then O. The report opens with the cursor on Company and nothing listed. Choose a company to see its statement.
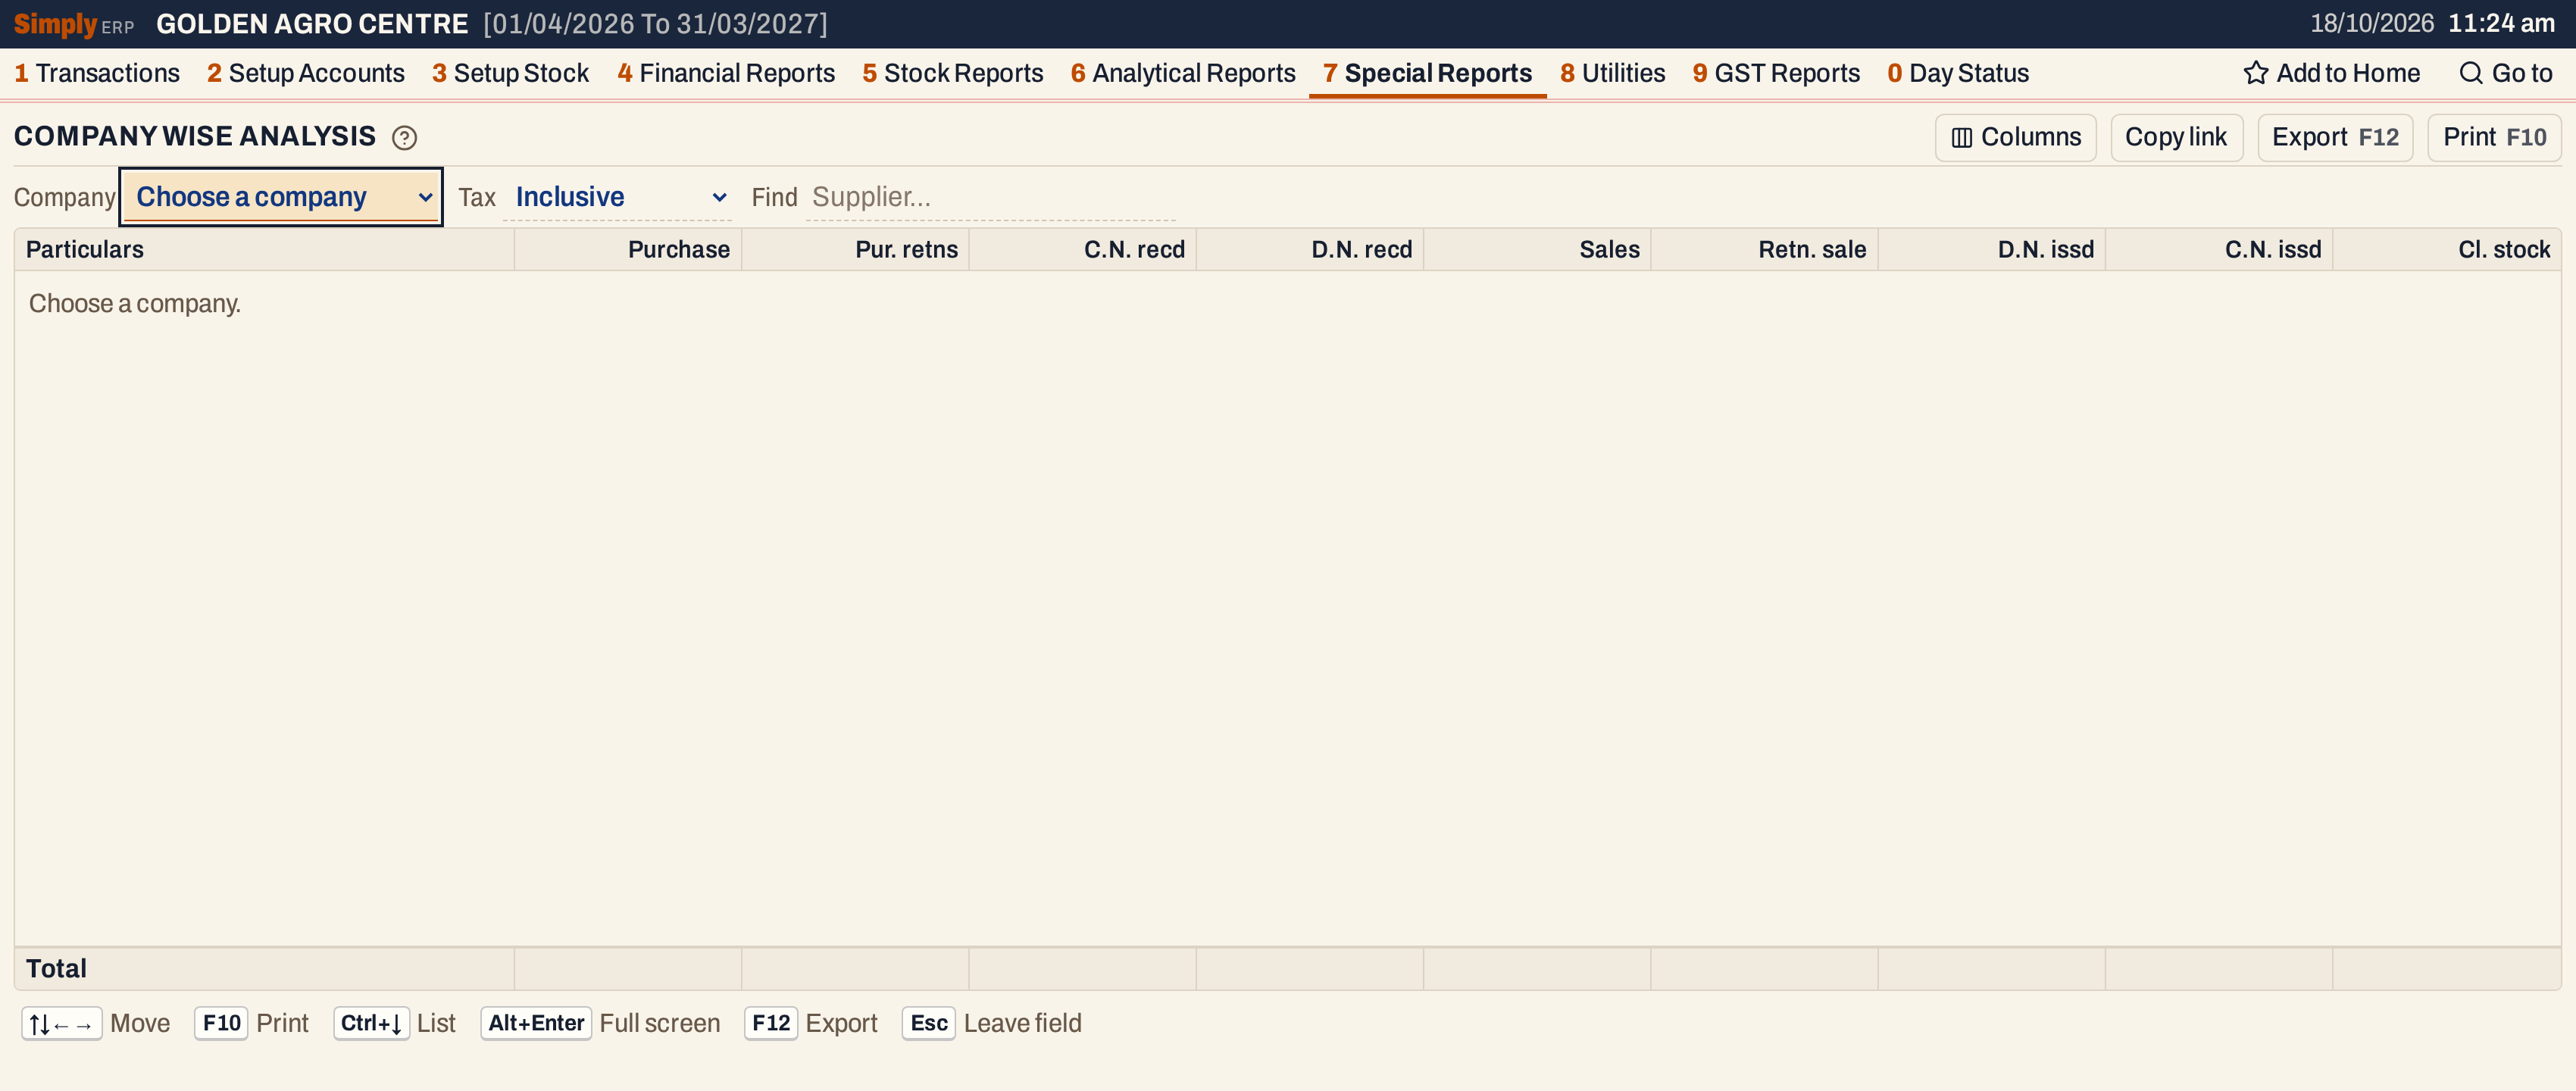 Nothing is listed until you choose a company.
Here Sitara Crop Sciences is chosen. The report always covers the whole financial year, not a period you pick.
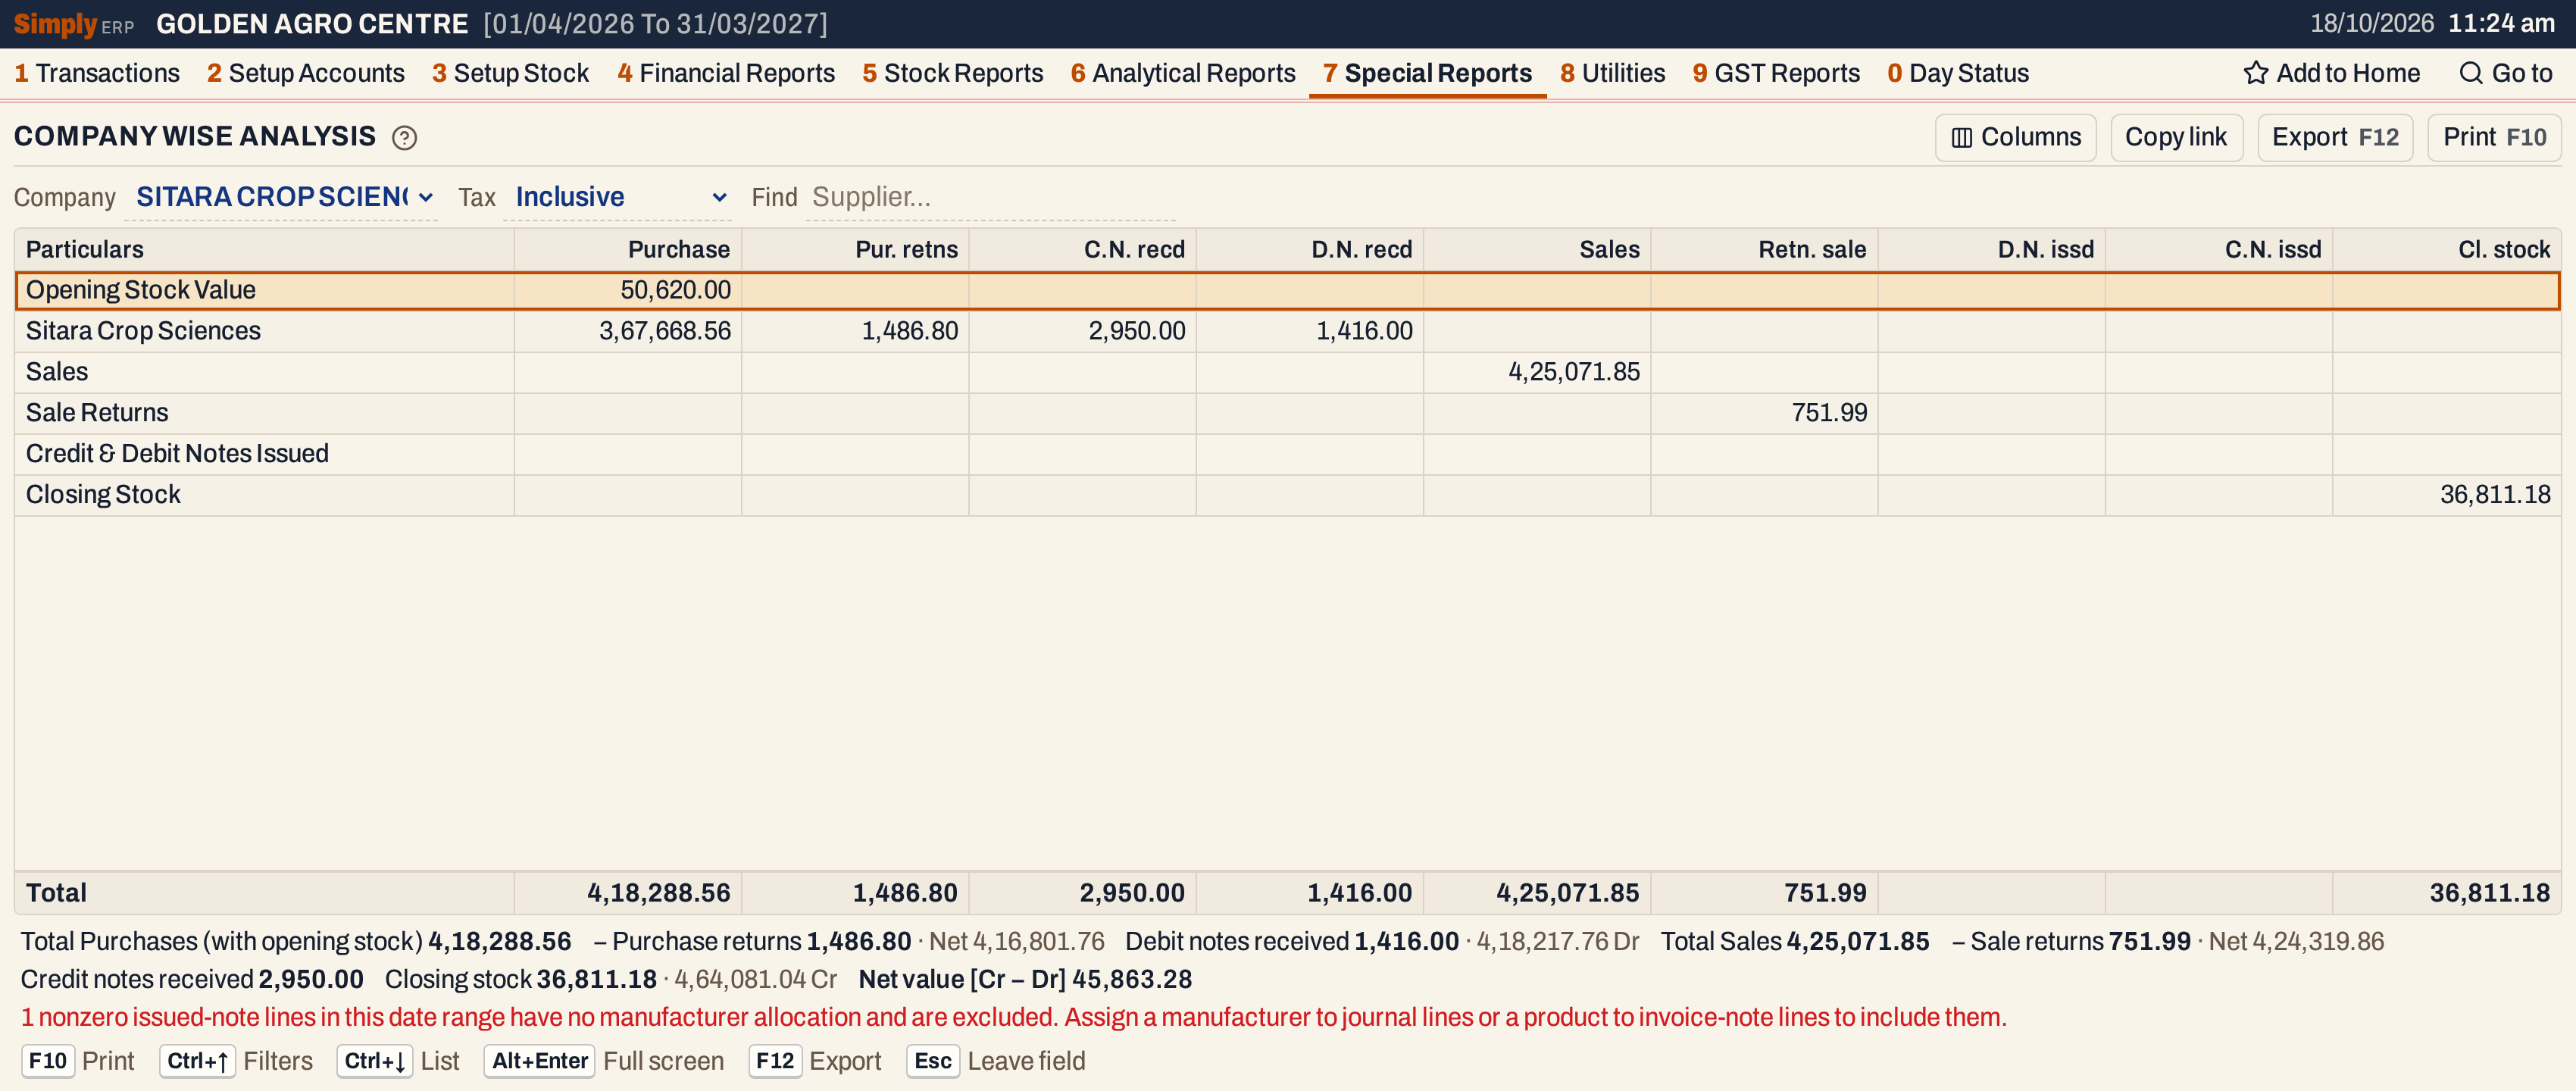 Each line is a part of the statement: the opening stock, one line for each supplier, then Sales, Sale Returns, Credit & Debit Notes Issued and Closing Stock.
What it lists
The statement has the same lines for every company, in this order:
- Opening Stock Value: the value of the company’s items at the start of the year. Its figure is in the Purchase column.
- One line for each supplier of the company’s items, in name order: what you bought from them, what you returned, and the notes they sent. A supplier appears when the year has a purchase bill or a purchase return from them with an item of this company on it.
- Sales: sales bills.
- Sale Returns: sales returns.
- Credit & Debit Notes Issued: the notes you issued for the company.
- Closing Stock: the value of the company’s items at the end of the year.
The company is the one set on each item (see Companies). The Company box lists every company that has at least one item. Only the item lines of bills are counted. Freight and other charges at the foot of a bill are not.
Columns
| Column | What it shows |
|---|---|
| Particulars | The name of the line. |
| Purchase | The opening stock value on the first line; on a supplier’s line, what you bought from them. |
| Pur. retns | Purchase returns to that supplier. |
| C.N. recd | Credit notes received from that supplier. |
| D.N. recd | Debit notes received from that supplier. |
| Sales | The sales of the company’s items, on the Sales line. |
| Retn. sale | Sales returns of the company’s items, on the Sale Returns line. |
| D.N. issd | Debit notes issued for the company, on the Credit & Debit Notes Issued line. |
| C.N. issd | Credit notes issued for the company, on the same line. |
| Cl. stock | The closing stock value, on the Closing Stock line. |
A figure that is nil is left blank. The Total line under the grid adds up each column of the lines on the screen. Click Columns to hide any of the nine figure columns; the print leaves them out too.
Choices
| Choice | What it does |
|---|---|
| Company | The company whose statement you want. There is no default; the report stays empty until you choose one. |
| Tax | Inclusive (the default) or Exclusive. It changes how sales, returns, purchase returns and the stock rates are counted; see How the figures are worked out. |
| Find | Shows only the lines whose Particulars match what you type. The Total line adds up only the lines left. The figures under the grid still cover the whole statement. |
Both choices and Find are kept in the page address, so Copy link gives a link that opens the same statement.
 The choices above the grid. The Company box cuts off the end of a long name.
How the figures are worked out
The report uses the financial year from its first day to its last. A bill counts by the date it is posted: the bill’s date, and for a purchase bill or a sales return the date you received the goods. Both end days are counted.
Purchase on a supplier’s line is the value of the company’s items on the purchase bills of the year from that supplier. A line’s value is its units times its unit cost. The unit cost is the line’s amount with GST divided by its units, rounded to paise: for a bill that records a GSTIN for the supplier, the taxable amount plus GST at the line’s rates; for any other bill, the line’s net amount. The Tax choice does not change this column.
Pur. retns is the purchase returns of the company’s items to that supplier. With Inclusive, each line counts its amount with GST. With Exclusive, it counts the amount before GST.
C.N. recd and D.N. recd are the credit notes received and debit notes received posted to the supplier’s account in the year, whatever items they cover. They are read from the supplier’s ledger: for a credit note received, the debits less the credits; for a debit note received, the credits less the debits. A note counts only on the line of a supplier who has a purchase or purchase return of this company in the year. A supplier who sells you more than one company shows the same notes under each company.
Sales is the item lines of the year’s sales bills for the company’s items, all payments together. With Inclusive, each line is its units times its unit cost on the same basis as a purchase, which is the amount the Sales Register shows. With Exclusive, each line is counted at its entered price before the line’s discount: a customer with a GSTIN counts the line’s amount before discount and GST, and a customer without a GSTIN, whose prices include GST, counts the line’s net amount plus its discount, GST included.
Retn. sale is the sales returns of the company’s items. Inclusive counts each line with its GST; Exclusive counts the amount before GST.
D.N. issd and C.N. issd are the debit and credit notes you issued, from the year’s journal entries and notes. A note counts only when its lines are tied to a manufacturer or product, so that the report knows which company it belongs to. A note that cannot be tied to one is left out. A red notice under the grid gives the number of such lines in the year, whatever the company.
 A credit note issued to a customer, made here for the example, has no item on it, so it belongs to no company and is left out.
Opening Stock Value is, for each of the company’s items, the units in stock at the start of the year times the opening rate, each item’s value rounded to the paisa and then added up. The units are the item’s opening stock plus what moved before the start of the year. The opening rate is the rate of the item’s latest purchase bill before the start of the year, as for Closing Stock below, if there is one, and otherwise the item’s opening price.
Closing Stock is, for each item, the units in stock at the end of the year times the closing rate, added up in the same way. The units are the opening stock, plus purchases and sales returns, less sales and purchase returns, less stock adjustments (Damages and breaks), and they include goods received or sent without a bill. The closing rate is the rate of the item’s latest purchase bill up to the end of the year, or the item’s opening price if there is none. With Inclusive the rate is the unit cost as described under Purchase. With Exclusive it is the price typed on that bill line, or the line’s amount divided by its units when the line was entered as an amount.
The figures under the grid then work out the totals:
- Dr = total purchases (with the opening stock) − purchase returns + debit notes received.
- Cr = total sales − sale returns + credit notes received + closing stock.
- Net value [Cr − Dr] = Cr + debit notes issued − Dr − credit notes issued.
 Dr is 4,18,288.56 − 1,486.80 + 1,416.00 = 4,18,217.76. Cr is 4,25,071.85 − 751.99 + 2,950.00 + 36,811.18 = 4,64,081.04. The net value is the difference, 45,863.28.
A positive net value means the company’s products have brought in more than they cost you, taking the stock in hand at its latest purchase rate.
Tax: Exclusive
Choose Exclusive to count sales, returns and the closing stock rate on the Exclusive bases described above. For the same company, Sales falls from 4,25,071.85 to 3,91,483.61, Pur. retns from 1,486.80 to 1,260.00, Retn. sale from 751.99 to 637.28, and the closing stock from 36,811.18 to 31,394.00. Purchases and the notes received stay as they were.
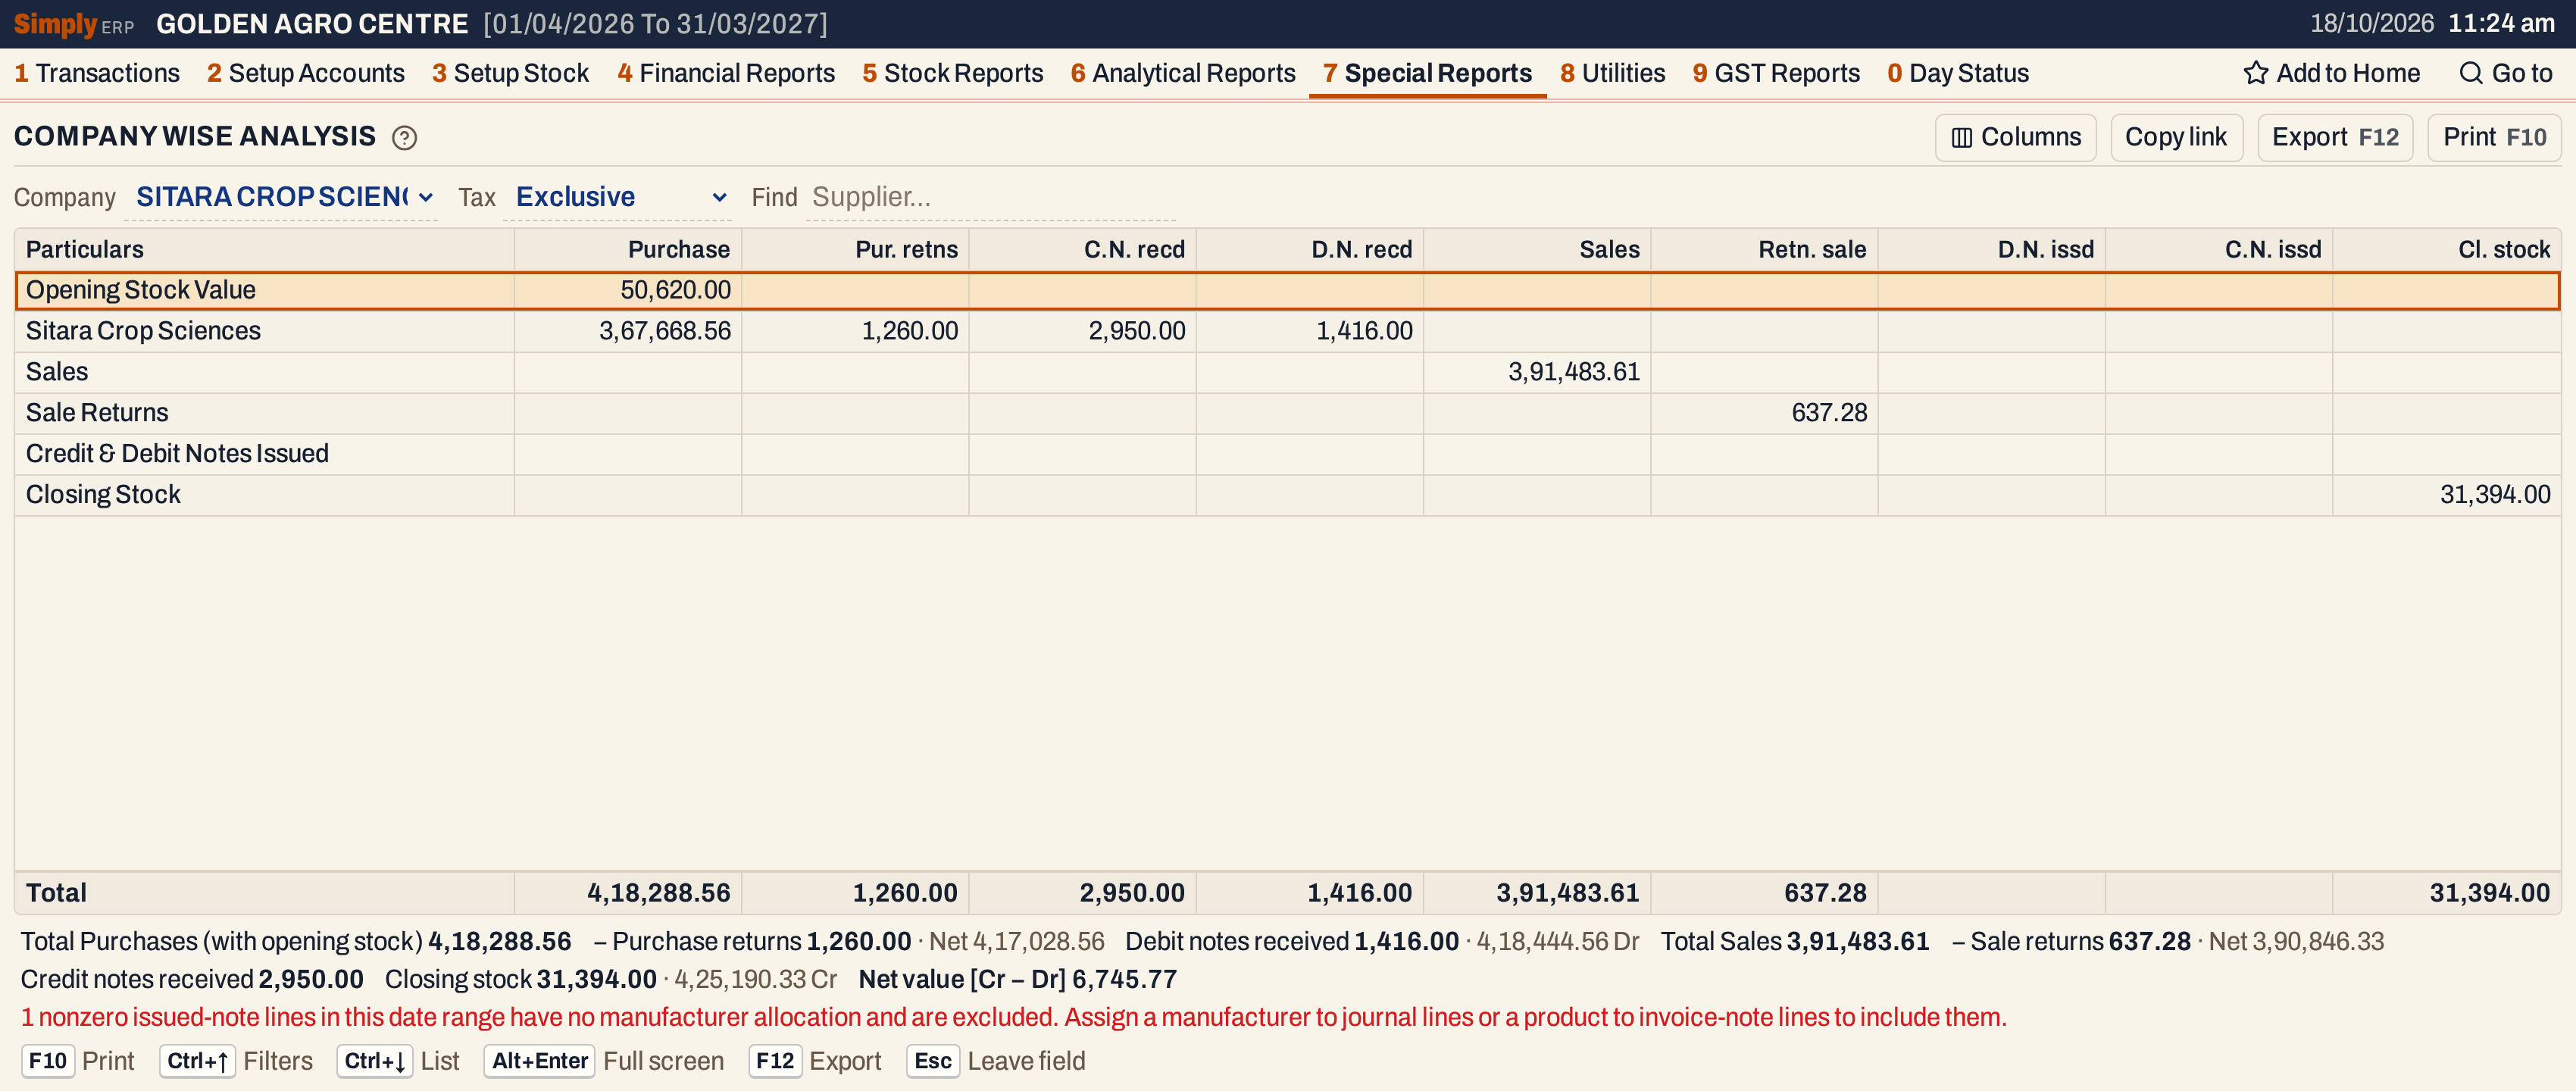 The same company with Tax Exclusive. The net value is 6,745.77.
Find
Type a supplier’s name to narrow the grid. Here sitara leaves the supplier line only, and the Total line adds up that line alone.
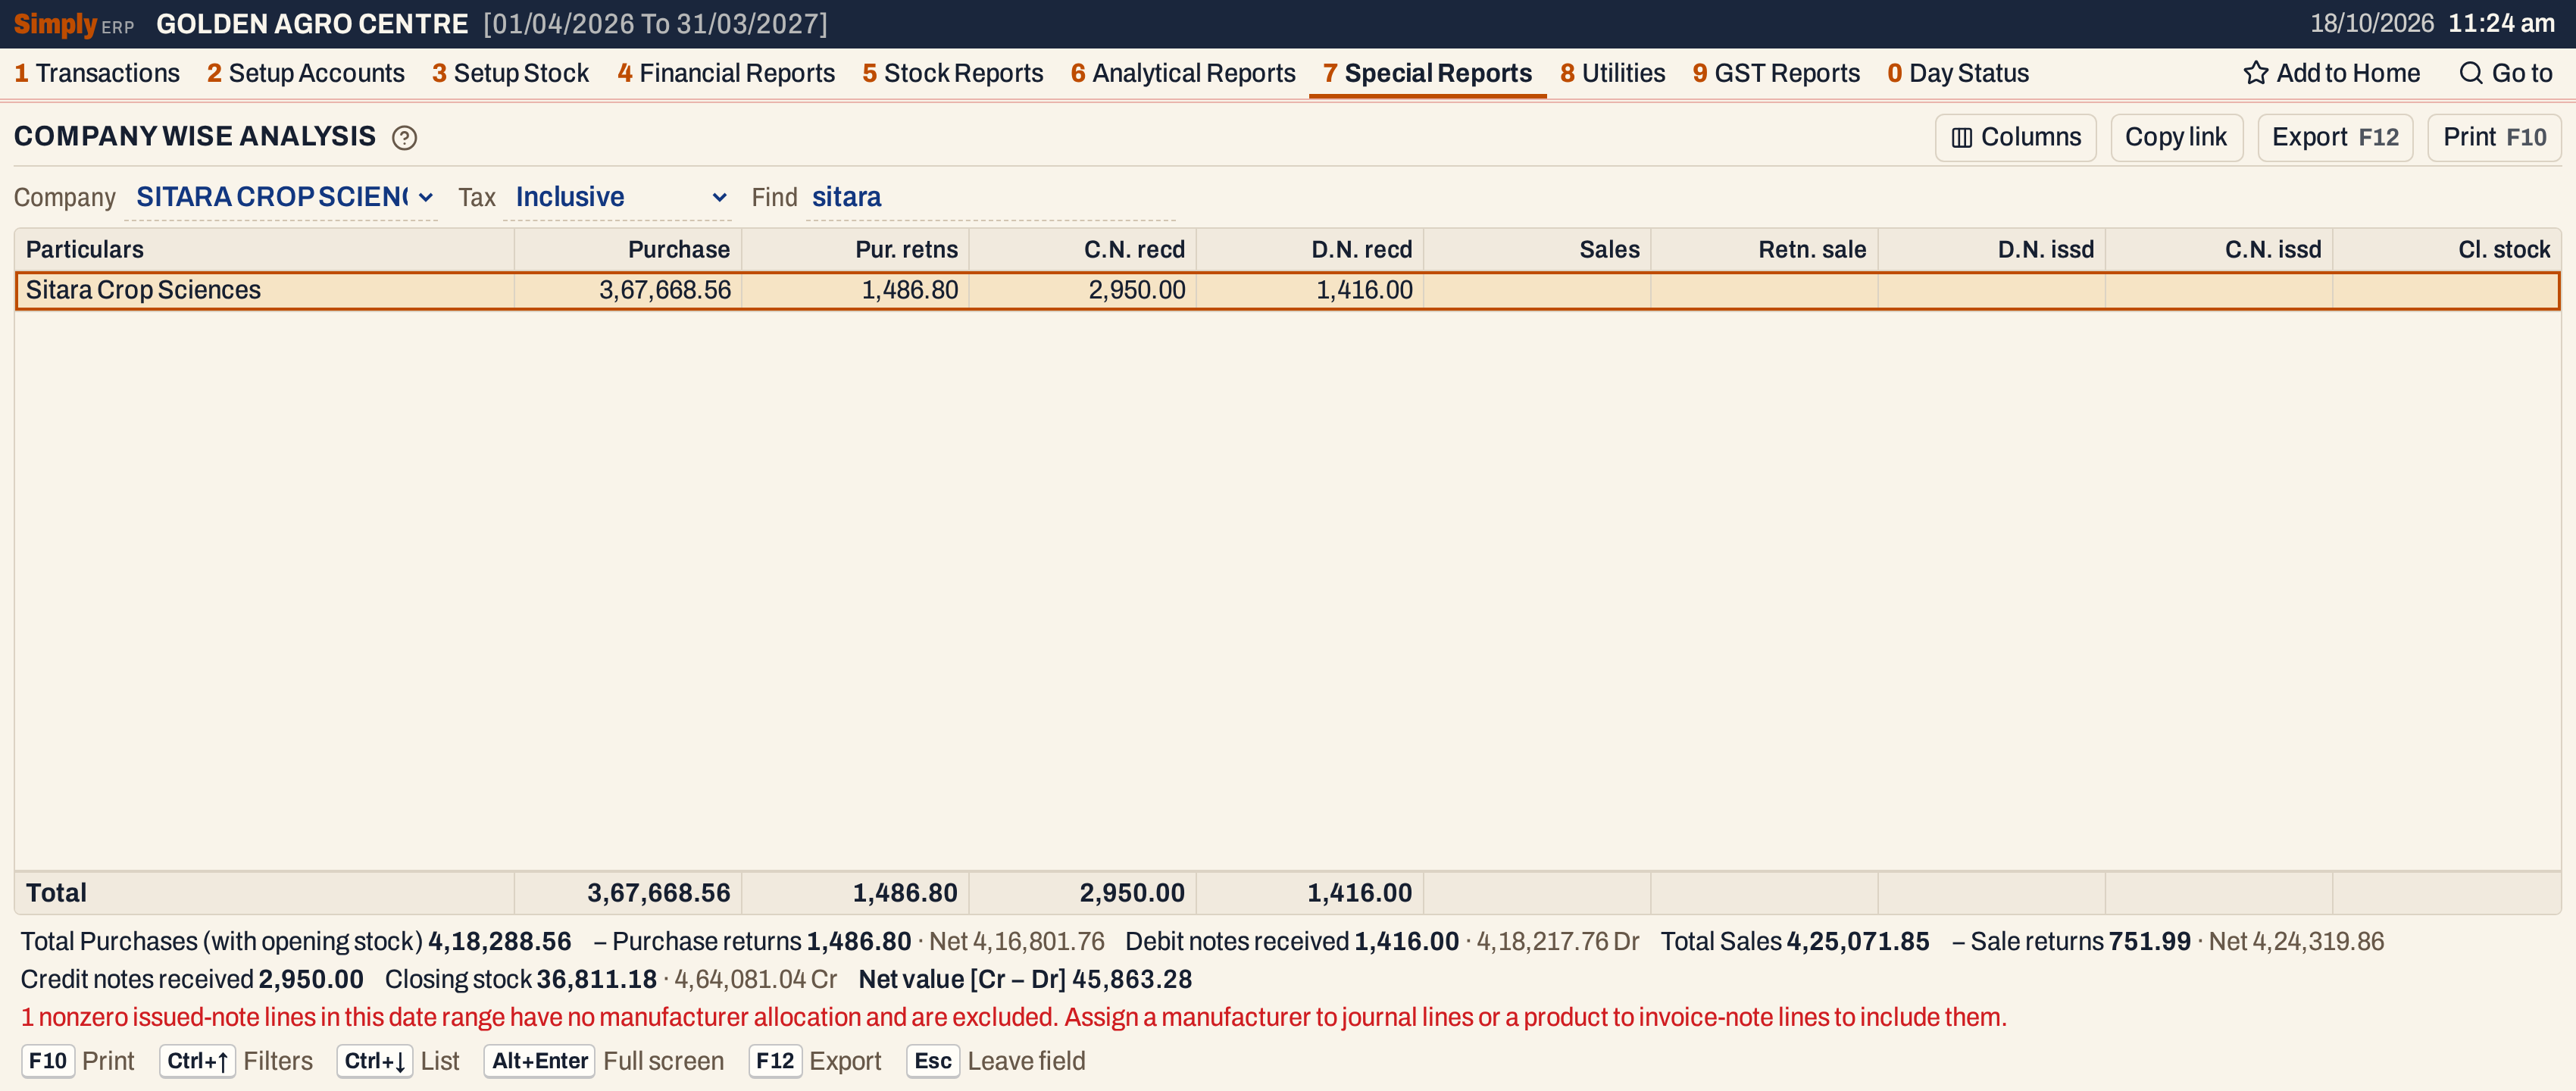 Find narrows the lines and the Total line. The figures under the grid still show the whole statement.
Open, print and export
- The lines have nothing to open and cannot be marked.
- F10 prints the statement under the title COMPANY WISE ANALYSIS. Its heading gives the company, whether tax is inclusive or exclusive, the year and any Find. The print has the same columns and ends with four lines: Totals, Dr Total, Cr Total and Net Value [Cr-Dr].
- F12 saves it as an Excel workbook.
- Alt+Enter gives the whole window to the grid.
Updated 4 November 2026.