Tech/Group Monthly Sales
On this page
The Tech/Group Monthly Sales report shows how much of each product group, or each technical name, you sold in every month of the financial year. Quantities are in litres or kilograms, so you can see which products sell in which months.
Open the report
Press Alt+7 for Special Reports, then I. The report opens for the financial year from its first day to today, with Rows on Group and Include returns ticked.
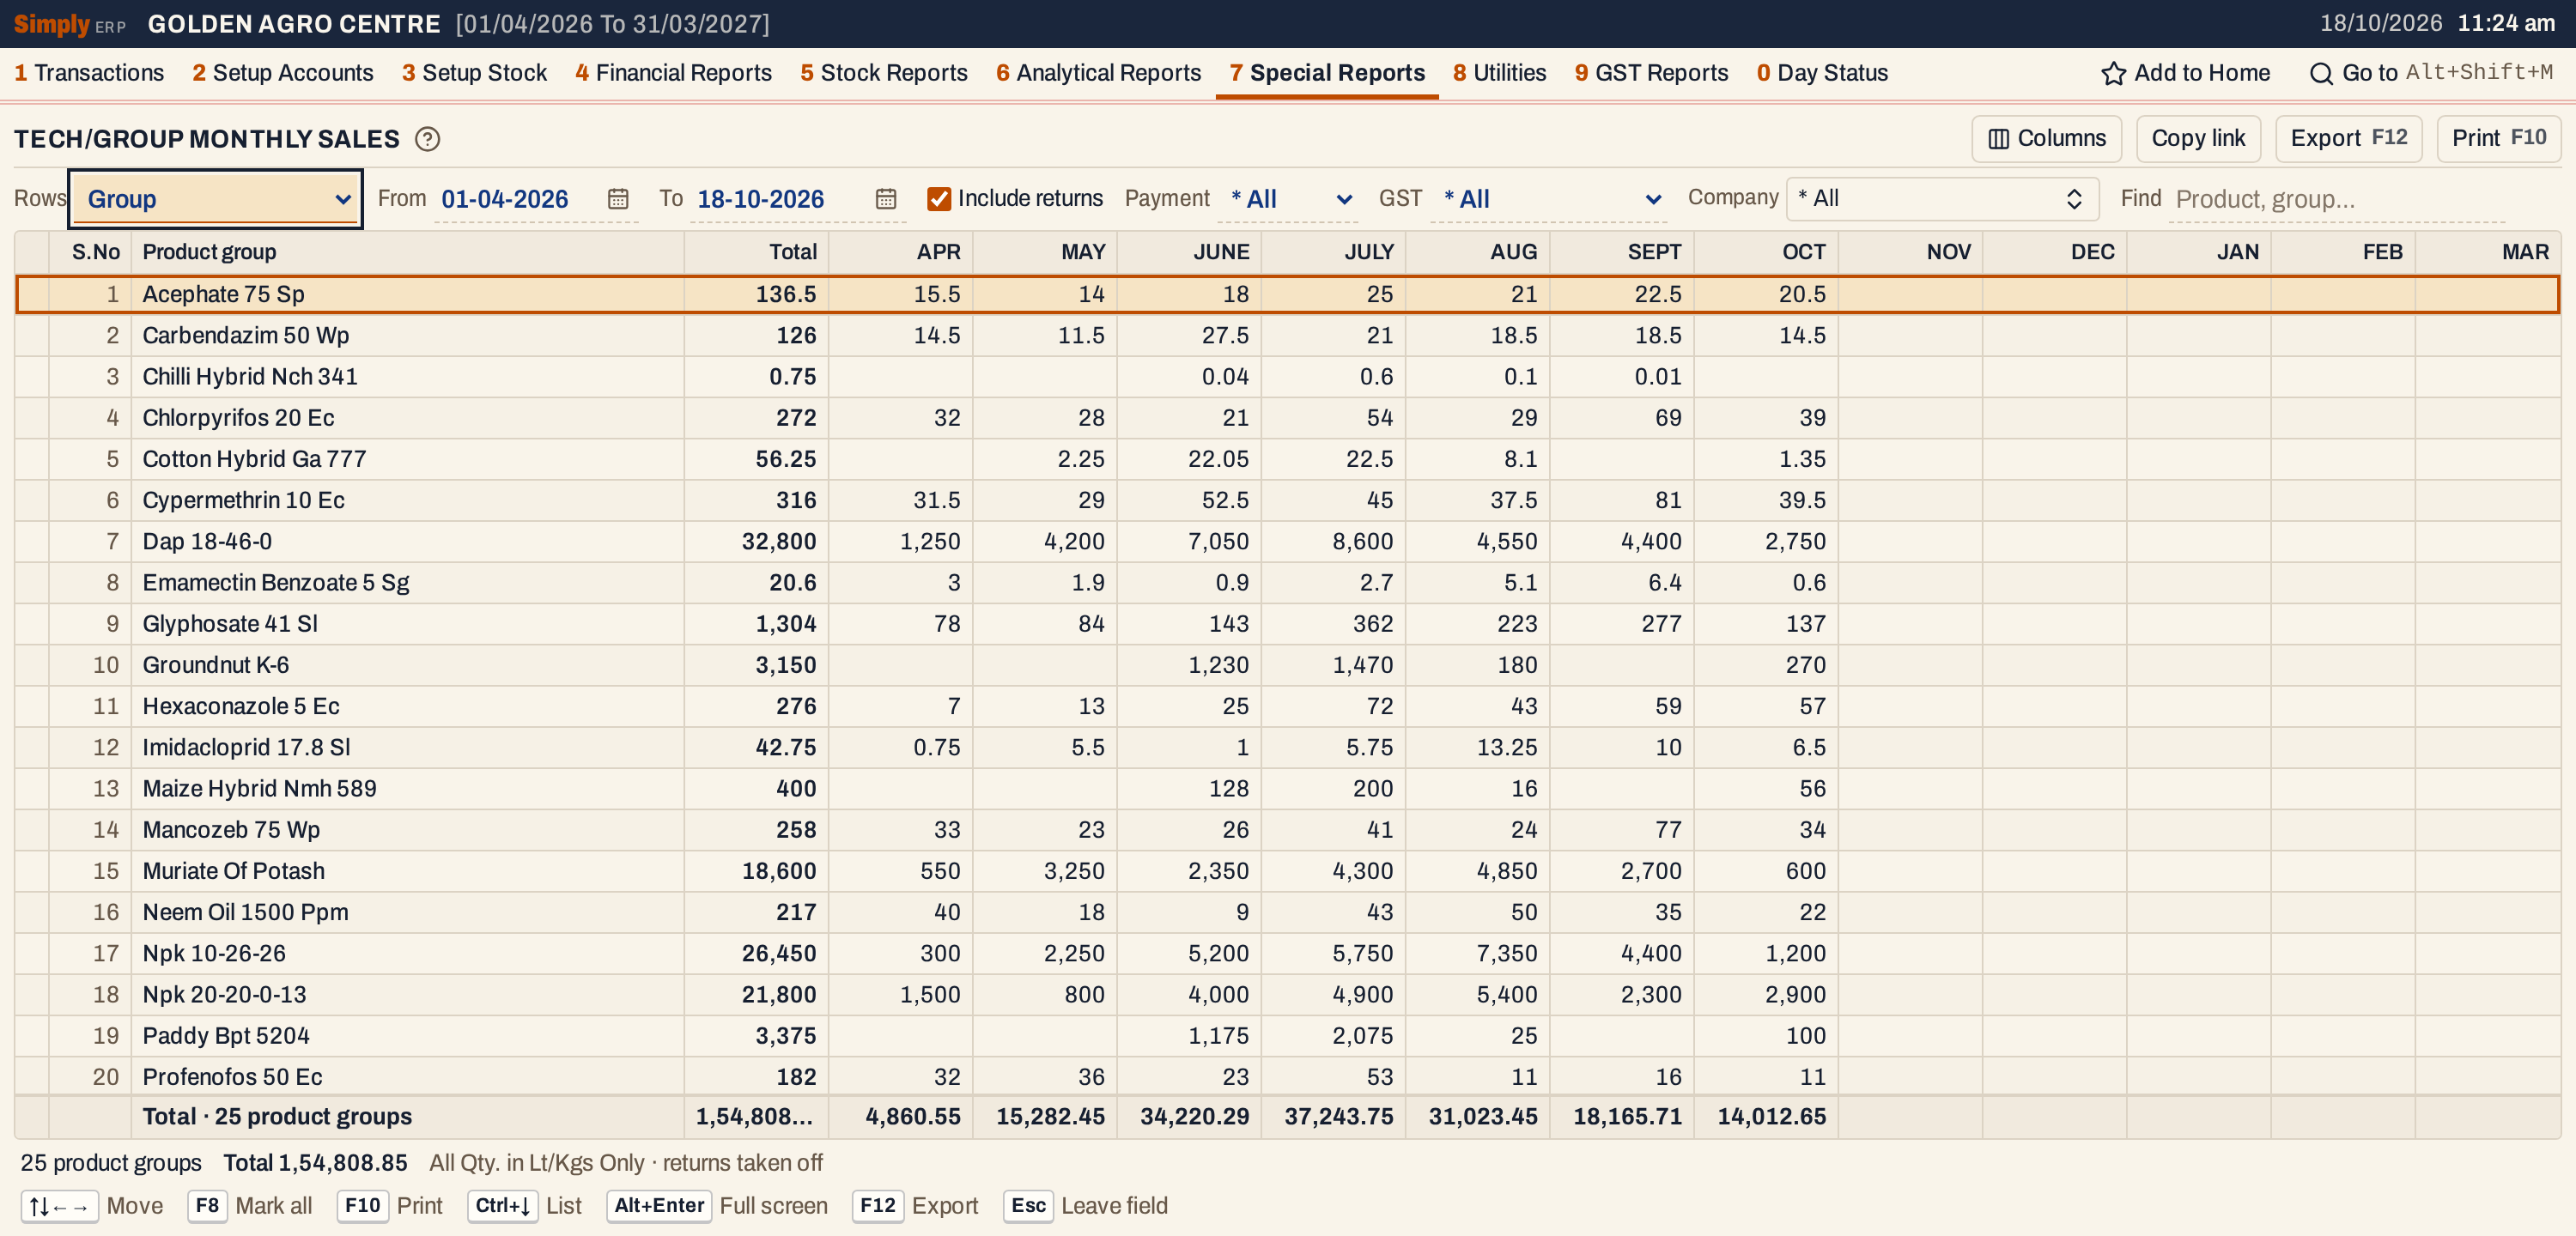 Each product group has a row. The months run from APR to MAR, and the Total is the sum of the months. NOV to MAR are empty because the books end on 18 October. The narrow Total column cuts the grand total short on the totals line; the status line gives it in full.
What it lists
One line for each product group, or for each technical name when Rows is on Technical name, that had a sale or a sales return in the period. A product with no group is listed under * General. A sale needs no customer account: cash sales count too.
- Sales bills, and sales returns when Include returns is ticked.
- Goods delivered and not yet billed, counted in the month they were delivered, and goods taken back and not yet billed, taken off. They are left out when Payment or GST is narrowed.
A product with no technical name does not appear when the rows are technical names.
Columns
| Column | What it shows |
|---|---|
| S.No | The number of the row. Hidden by Columns. |
| Product group, or Technical name | The name of the group or technical name, as the stock records it. With Rows on Technical name, the technical names of the products (Technical Names). |
| Total | The sum of the months, from April to March. |
| APR to MAR | The quantity in litres or kilograms sold in that month. A blank cell means nothing was sold that month. |
The totals line adds up each column. The status line gives the number of rows, the total of the Total column and the note on returns.
Choices
| Choice | What it does |
|---|---|
| Rows | Group (the default) lists product groups. Technical name lists the technical names of the products. |
| From, To | The period, from the financial year’s first day to today at first. Both days are included. |
| Include returns | Ticked by default. Sales returns are taken off the month in which they were made. Untick it to leave the returns out. It works with Rows on Group only: with Technical name rows the report always takes returns off, ticked or not. |
| Payment, GST | Payment: * All (the default), Cash or Credit bills. GST: * All (the default), Registered or Unregistered customers, those with and without a GSTIN. They narrow the sales and the returns, and they leave out goods delivered and not yet billed. |
| Company | Only the products of the chosen manufacturers. * All is the default. It shows with Rows on Group only. |
| Category | Only the products of one category. * All is the default. It shows with Rows on Technical name only. |
| Technical | The technical names to show. * All is the default. It shows with Rows on Technical name only. |
| Find | Shows the rows whose name matches what you type. |
 The choices above the grid, with Include returns ticked. With Rows on Group, Company is offered.
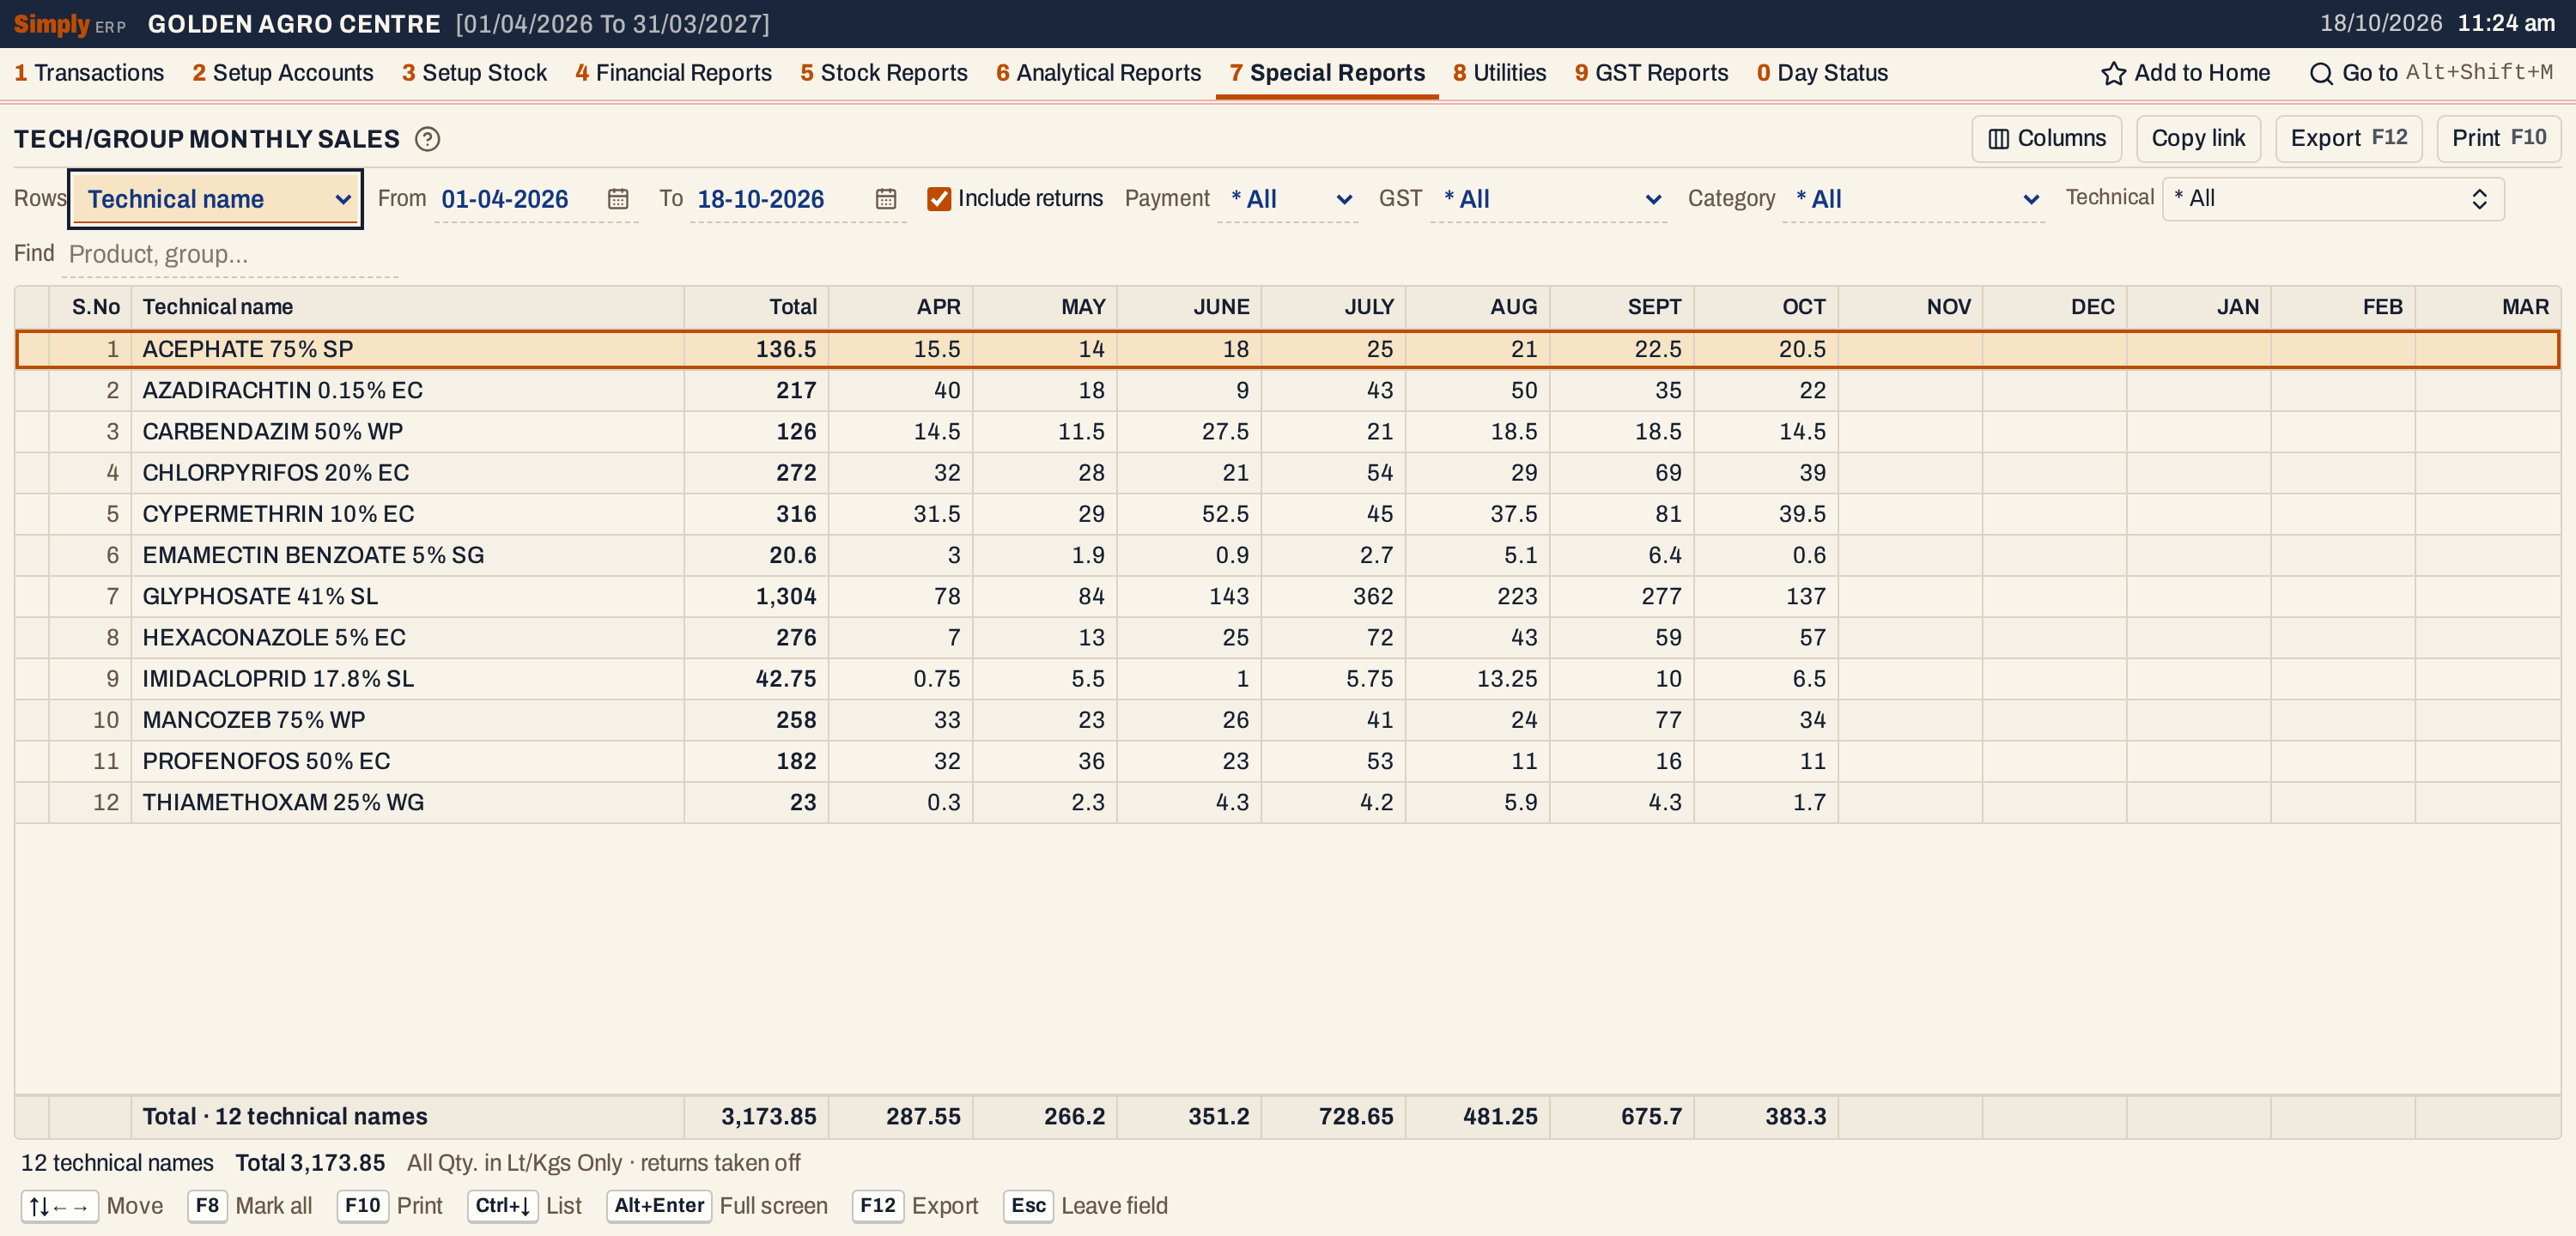 Rows set to Technical name. Category and Technical appear beside the choices.
How the figures are worked out
For each bill line of a product, in the period:
- Quantity = the units billed, multiplied by the size in litres or kilograms of the product’s packing (set in Packings). A product whose packing has no size adds nothing. Every figure is in Lt/Kgs; the report has no units option.
- A sale adds the quantity to the month of the bill’s date. A sales return takes it off the month of the return, when Include returns is ticked.
- Goods delivered and not yet billed add the quantity that is still unbilled, less any part already billed, to the month of the delivery. Goods taken back and not yet billed take it off in the same way.
- Each month is rounded to two decimal places after the billed and unbilled quantities are added together.
- Total = the sum of the twelve months, and each totals line is the sum of its column.
The months follow the financial year: APR is April and MAR is March. A row’s name is the product group, or the technical name, as the stock records it.
 The status line gives the number of rows, the total, the unit and whether Include returns is ticked.
Open, mark, print and export
- Enter on a row opens the Stock Statement for the same period: for a technical name, with that technical name chosen; for a group, with the group’s name typed in Find.
- F2 marks a row and F8 marks them all. F10 then prints only the marked rows.
- F10 prints the report with the period, the unit and your choices. Its heading says whether returns are included or left out. Columns hides S.No and months, and the print leaves them out too.
- F12 saves the printed report as an Excel workbook, with the figures as numbers.
- Alt+Enter gives the whole window to the list.
Updated 4 November 2026.