Customer vs Product Sales
On this page
The Customer vs Product Sales report shows what one customer has bought from you, product by product, with each bill line and the sales returns the customer made. Use it to see which products a customer buys, how often, and what they came to, or to answer a customer who asks what they bought last season.
Open the report
Press Alt+6 for Analytical Reports, then E. Choose the Customer first: the report shows nothing until you do. The period starts on the first day of the financial year and ends on today. You can choose a customer, a customer-supplier or a farmer account.
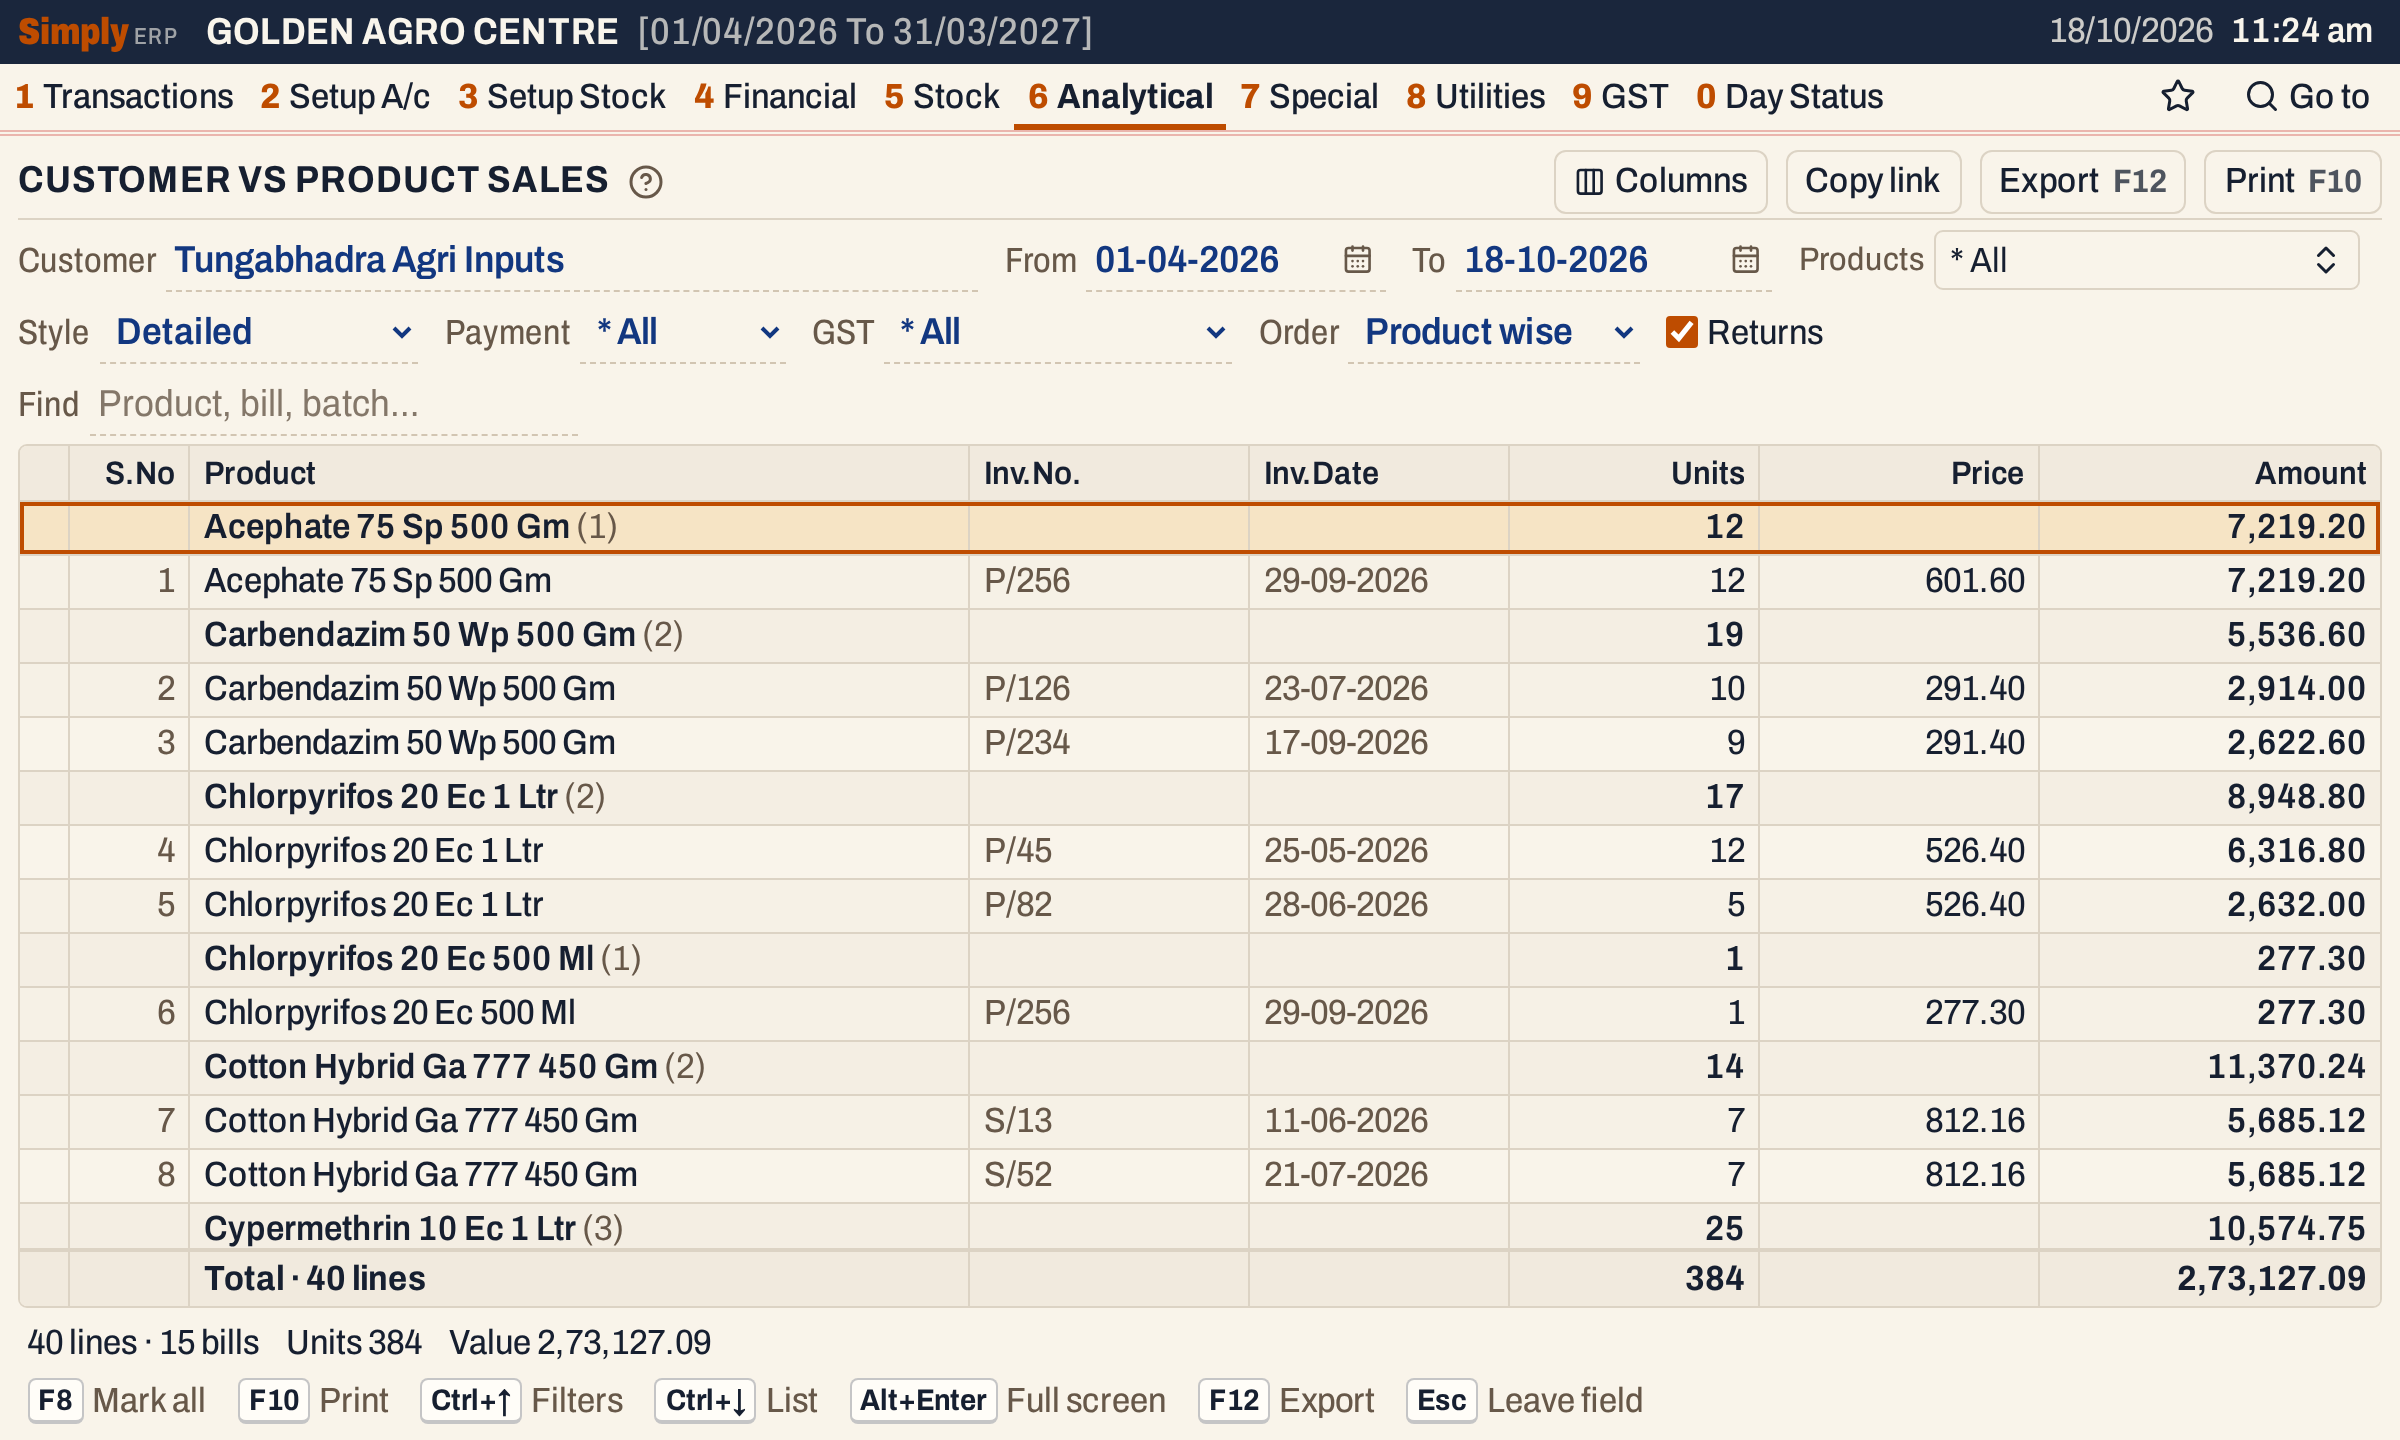 Each product is a heading with its totals. Under it are the customer’s bill lines for that product. This picture hides the Type, Bat.No. and Lts/Kgs columns with the Columns button, so that Price and Amount fit the window.
What it lists
- Sale bills to the customer in the period: each item line of the bill is one line in the report. The bill’s charges, such as freight or round off, are not lines.
- Sales returns of the customer in the period, when Returns is ticked. A return is a negative line under its product, in red.
A sale bill counts on its own date and a sales return on the day it was received (the Recd. date on the return). The Products, Payment and GST choices narrow these.
Purchases, GST credit and debit notes and counter sales with no customer account are not in this report.
Columns
These columns show with the Detailed style. The Columns button hides S.No, Type, Bat.No., Lts/Kgs and Price in Detailed; S.No and in Lts/Kgs in Summary; and S.No, in Lts/Kgs and Avg.Price in Groups.
| Column | What it shows |
|---|---|
| S.No | The line’s number. Hidden with Columns. |
| Product | The product’s name. In Detailed, a heading row for each product carries its totals and, in brackets, the number of lines under it. |
| Type | Return, on a sales return line. Hidden with Columns. |
| Bat.No. | The batch of the line. Hidden with Columns. |
| Inv.No. | The bill’s number, or the return’s number. |
| Inv.Date | The date the line counts on: the bill’s date, or the day the return was received. |
| Units | The units sold, or returned (negative). |
| Lts/Kgs | The quantity in litres or kilograms: units times the pack size. Hidden with Columns. |
| Price | The net rate per unit: the line’s value after its discounts, with GST, divided by its units. Hidden with Columns. |
| Amount | The line’s value: units times the Price. |
The Summary style has its own columns: Sales (units sold), Retns (units returned), Net, in Lts/Kgs (the net litres or kilograms), Sale.Amt and Net Sales. The Groups style has in Lts/Kgs, Avg.Price and Net Sales, with the product group in the first column.
Choices
| Choice | What it does |
|---|---|
| Customer | The customer to report. Required. |
| From, To | The period. The defaults are the first day of the financial year and today. Both dates must fall in the financial year. |
| Products | Shows only the products you tick. The default is * All. |
| Style | Detailed (the default): every bill line, under a heading for each product. Summary: one line for each product. Groups: one line for each product group, which is the product’s name without its pack, so the 1 Ltr and 5 Ltr packs of Glyphosate 41 Sl are one group. |
| Payment | * All (the default), Cash or Credit: the payment mode of the bill or return. |
| GST | * All (the default), Registered or Unregistered: whether the bill or return was to a customer with a GSTIN. |
| Order | Product wise (the default): by product, then the sales before the returns, then by date and bill number. Invoice wise: by date, then bill number, then product. Only in Detailed. |
| Returns | Shows the customer’s sales returns under their products. Ticked by default. Only in Detailed. |
| Find | Shows only the lines where every word you type is found in the product, its manufacturer, the bill number or the batch. A word of three or more letters also matches when its letters appear in that order, close together. |
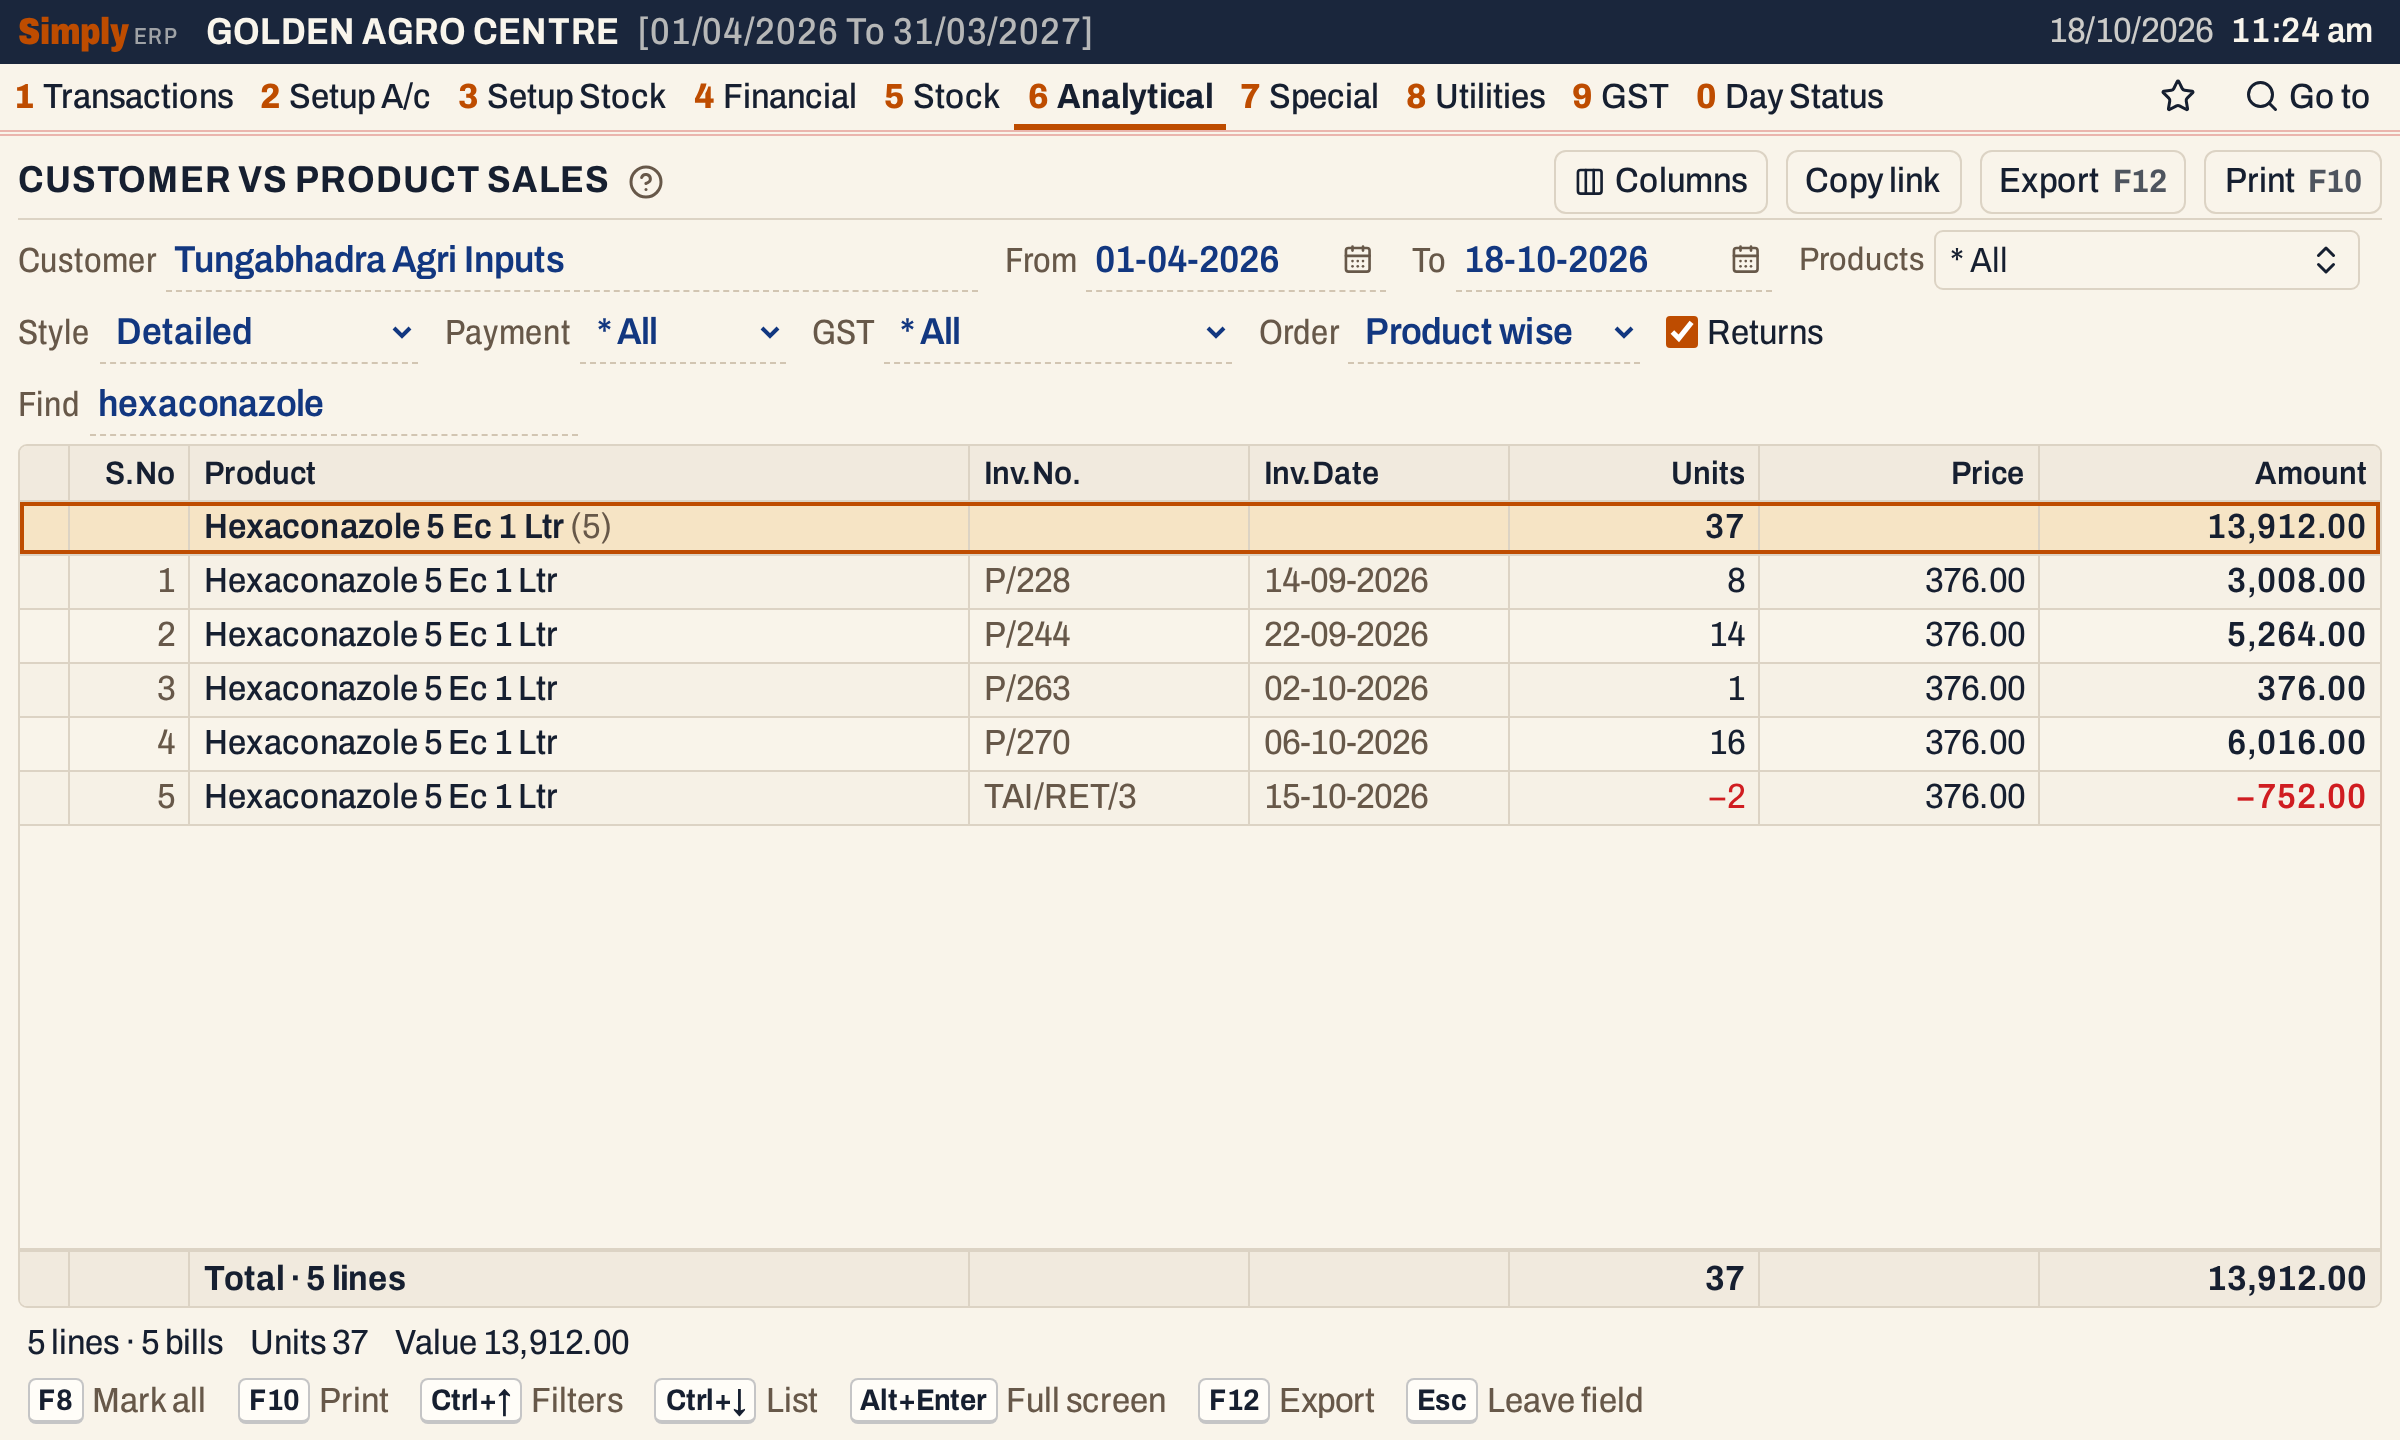 Find narrows the report to one product. Here the return of 2 units (TAI/RET/3, 15-10-2026) is the red line at the foot.
How the figures are worked out
For each bill line of the customer:
- Units = the units on the line. A return counts as negative units.
- Price = the line’s value after its discounts, with GST, divided by its Units and rounded to paise.
- Amount = Units × Price. For example, 16 units at 376.00 come to 6,016.00. A return’s Amount is negative, the same way. Because the Price is rounded first, an Amount can differ by a few paise from the line’s value on the bill.
- Lts/Kgs = Units × the pack size of the product in litres or kilograms: 30 units of a 50 Kg pack are 1,500.
The product heading adds up the lines under it: Units, Lts/Kgs and Amount. The Total line adds up every line shown, and the status line below gives the same totals with the number of lines and bills.
In the Summary style, for each product:
- Sales = units sold, and Retns = units returned.
- Net = Sales − Retns.
- in Lts/Kgs = the Lts/Kgs sold less the Lts/Kgs returned.
- Sale.Amt = the Amount of the sales, 39 × 376.00 = 14,664.00 for Hexaconazole 5 Ec 1 Ltr.
- Net Sales = Sale.Amt less the Amount of the returns: 14,664.00 − 752.00 = 13,912.00.
Summary and Groups add up the same Amounts as Detailed, so all three show the same net total, 2,73,127.09 here.
In the Groups style, for each product group:
- Net Sales = the Net Sales of all the products in the group.
- in Lts/Kgs = their net Lts/Kgs added together.
- Avg.Price = Net Sales ÷ in Lts/Kgs. For Acephate 75 Sp: 7,219.20 ÷ 6 = 1,203.20. The total line’s Avg.Price divides the whole Net Sales by the net Lts/Kgs of all groups, so it mixes kilograms and litres.
Values are shown with Indian grouping and two decimals.
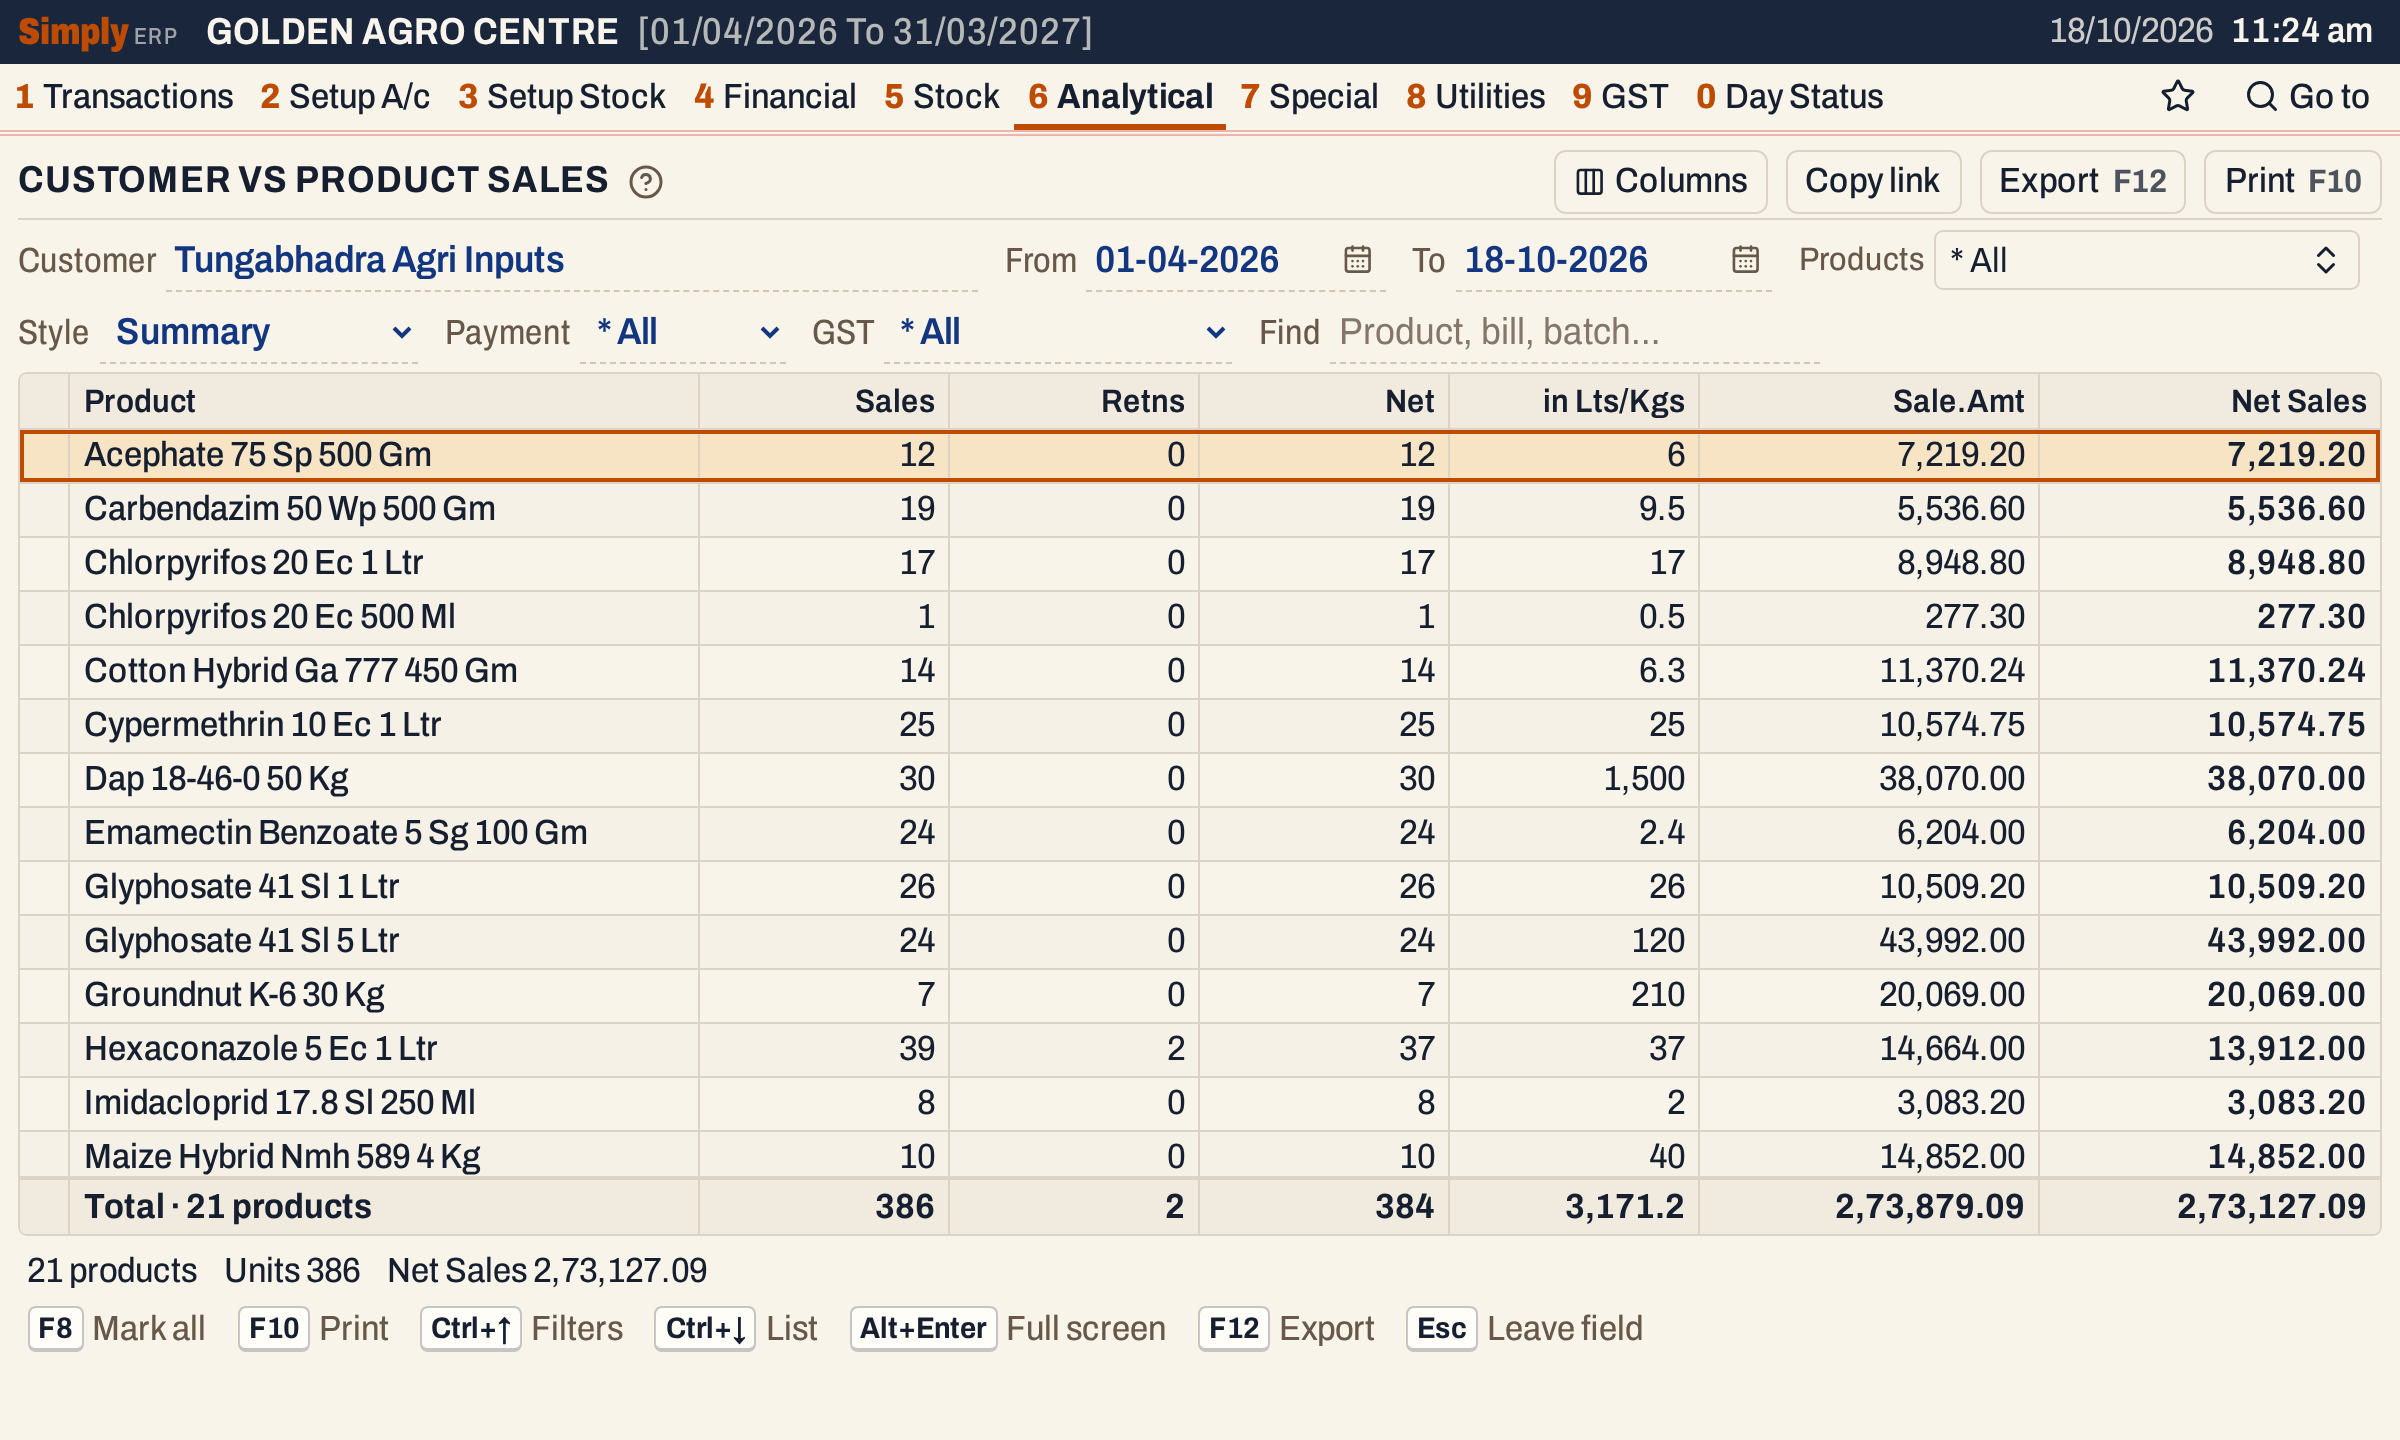 Summary gives one line for each product, with the units and the values of its sales and returns.
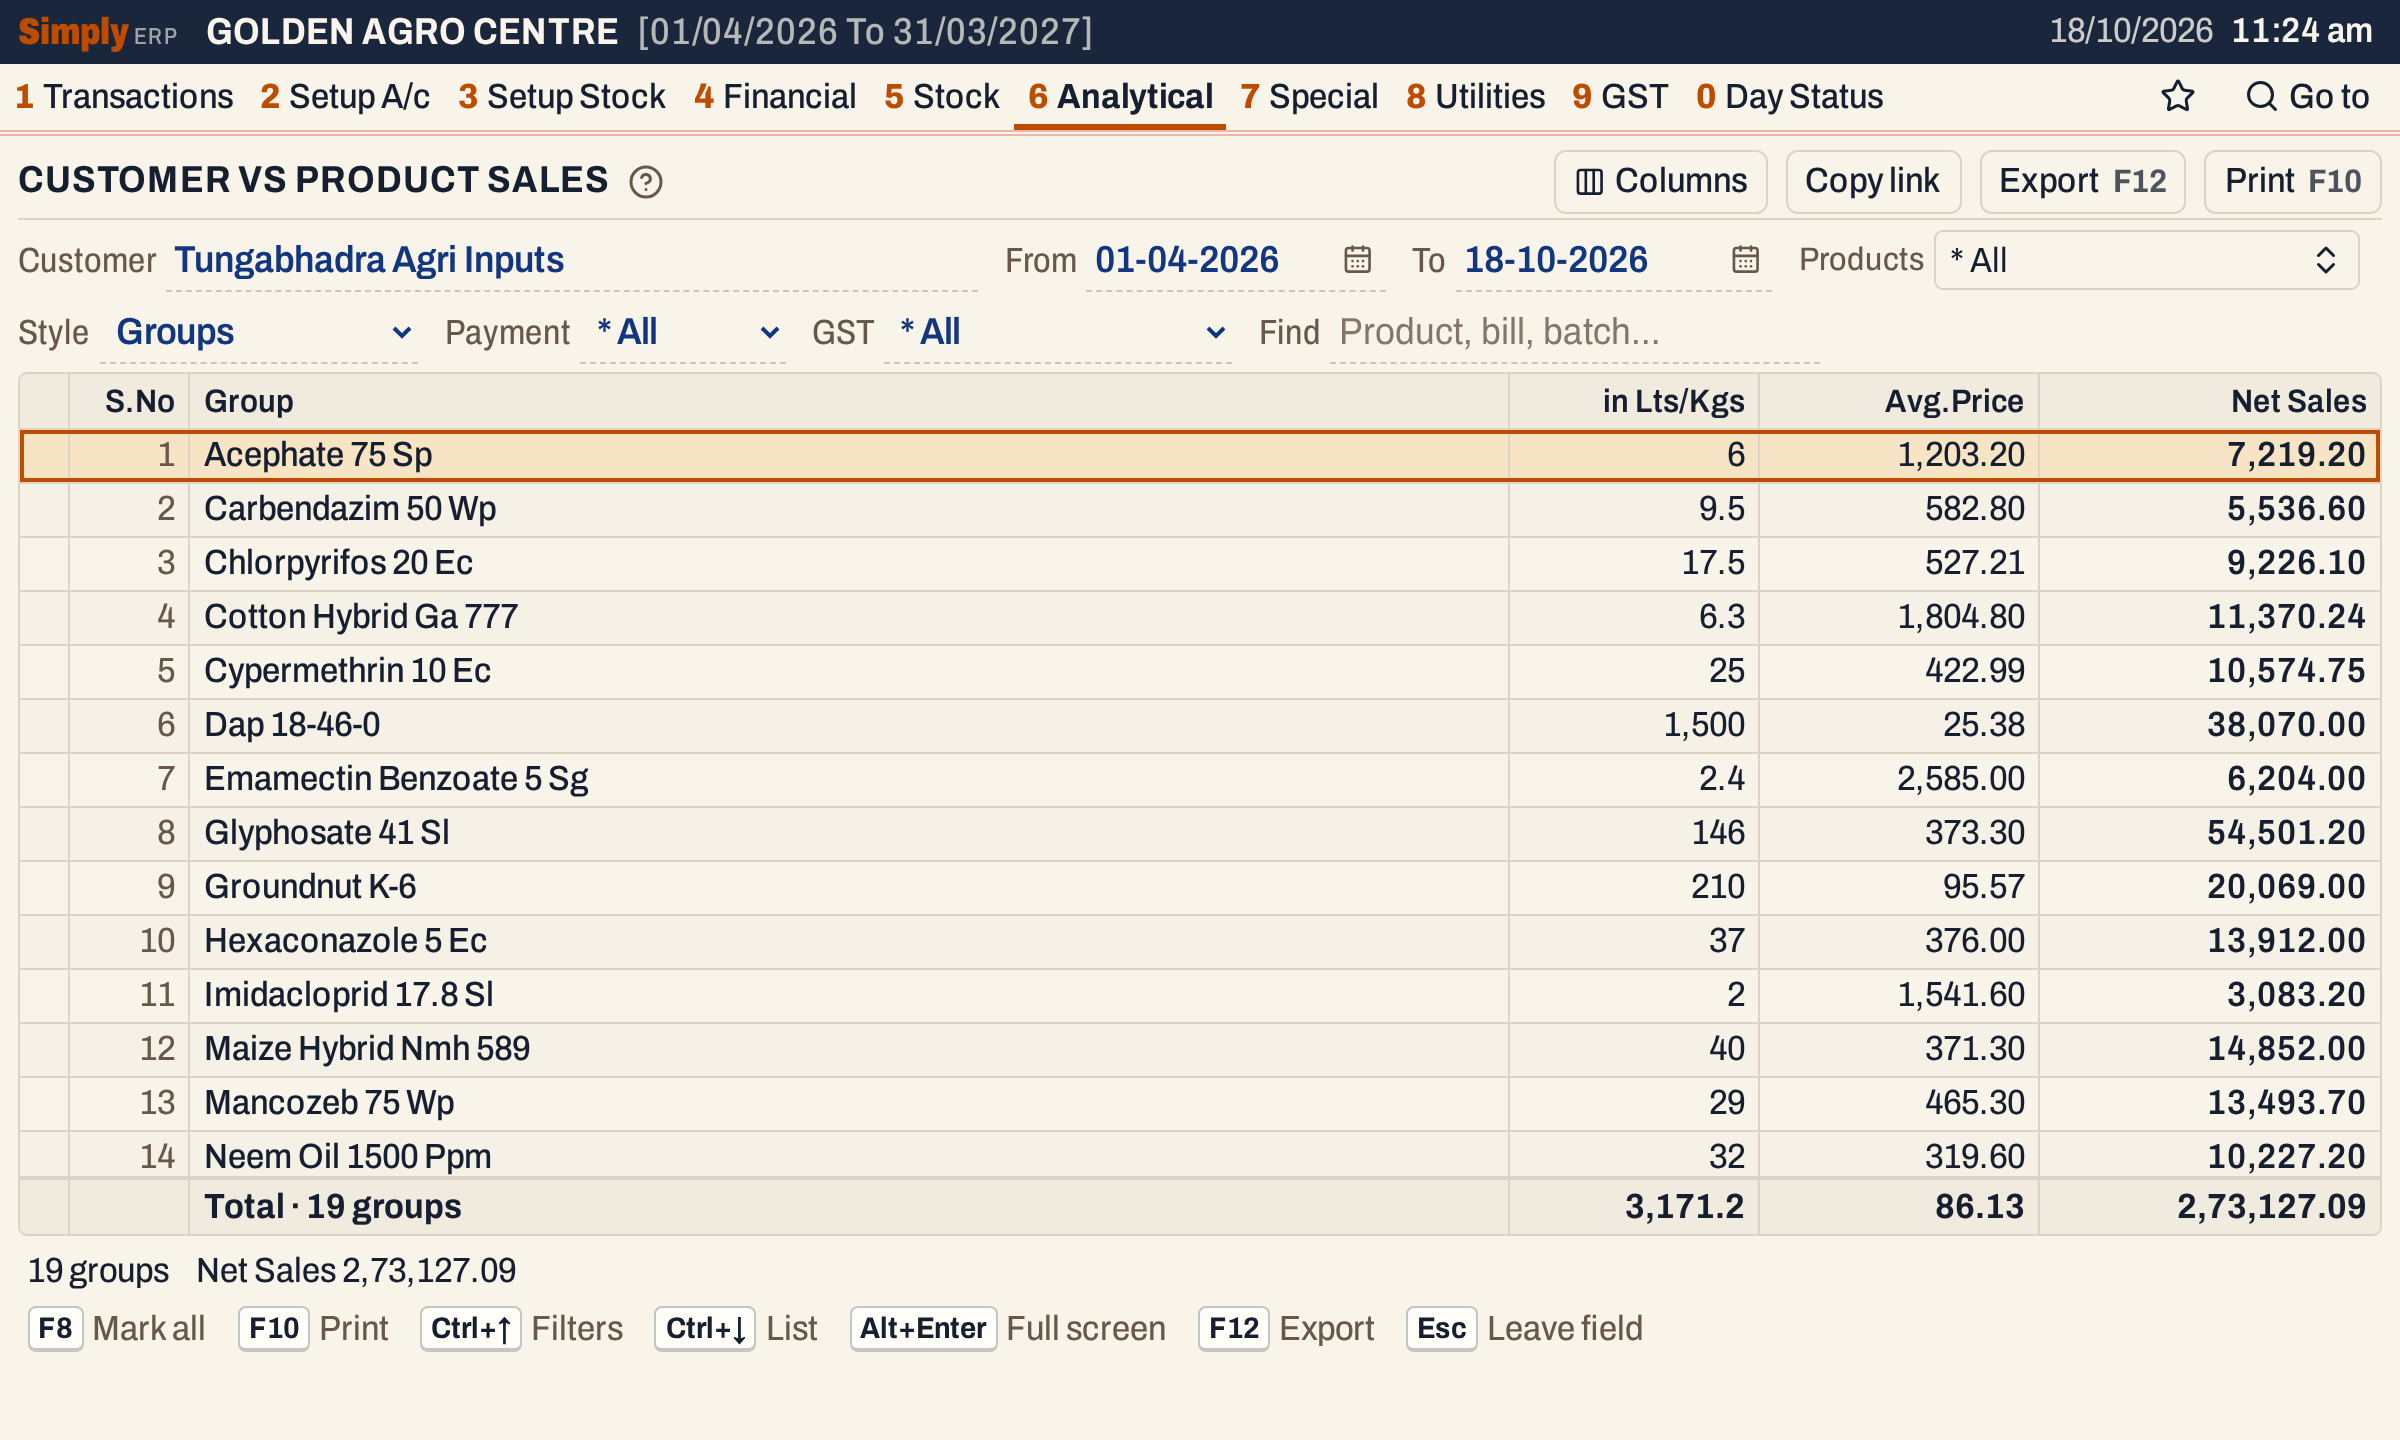 Groups gives one line for each product group. Its Avg.Price is the Net Sales over the group’s net litres or kilograms: 54,501.20 ÷ 146 for Glyphosate 41 Sl.
Open, mark, print and export
- Enter on a bill line in Detailed opens the bill. In Summary, Enter on a product opens its lines in Detailed. In Groups, it opens the lines of the group’s products.
- F2 marks a line and F8 marks them all. F10 then prints only the marked lines.
- F10 prints the report as it is on the screen, with the customer, the period and your choices. The Detailed print ends with COMPANY WISE TURNOVER, the net Amount of each manufacturer’s products with the returns taken off, when more than one manufacturer is in it and no lines are marked.
- F12 saves it as an Excel workbook.
- Alt+Enter gives the whole window to the list.
Updated 4 November 2026.